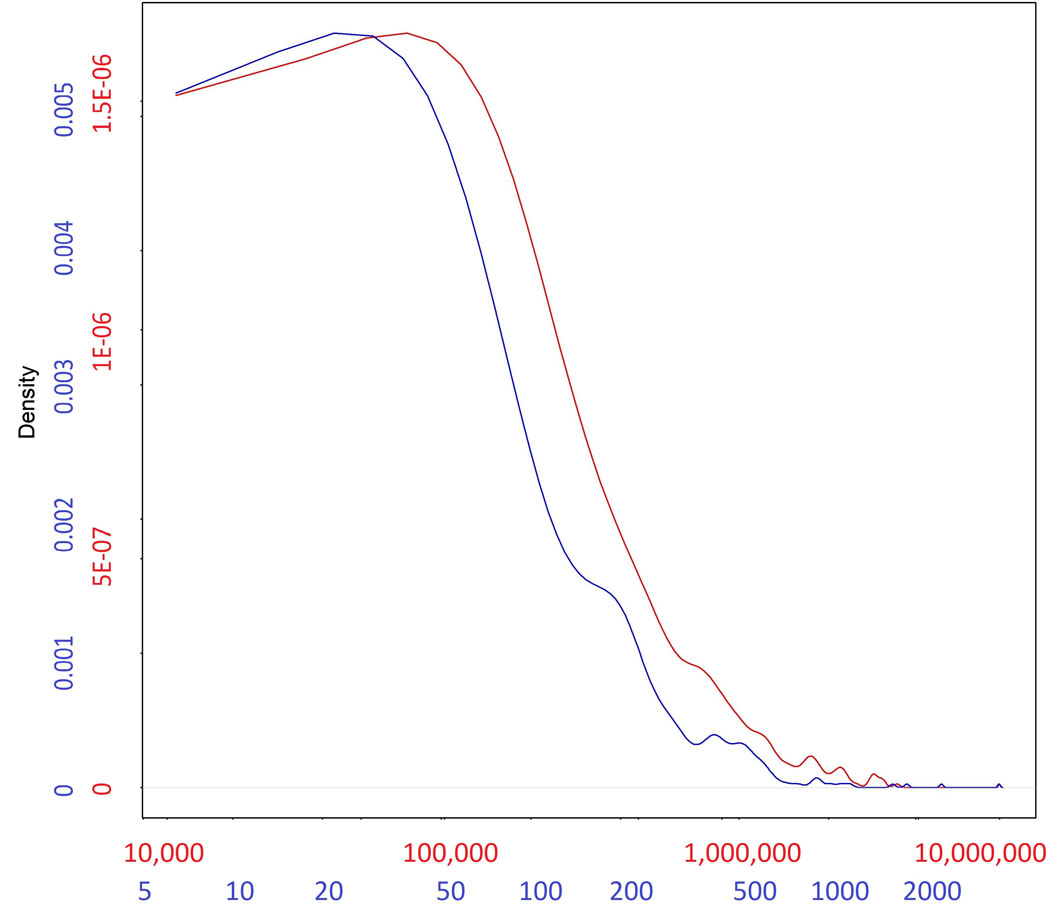
Extended Data Fig. 3:
Distribution of the base-pair length (red) of the 449 regions associated in the meta-analysis of all available cohorts (from Supplementary Table 3), alongside the distribution of number of SNPs (blue) for each region. Numbers in each of the axes in the figure are differentially colored to match the density curve they correspond to: red for the length of the region and blue for the number of SNPs.

