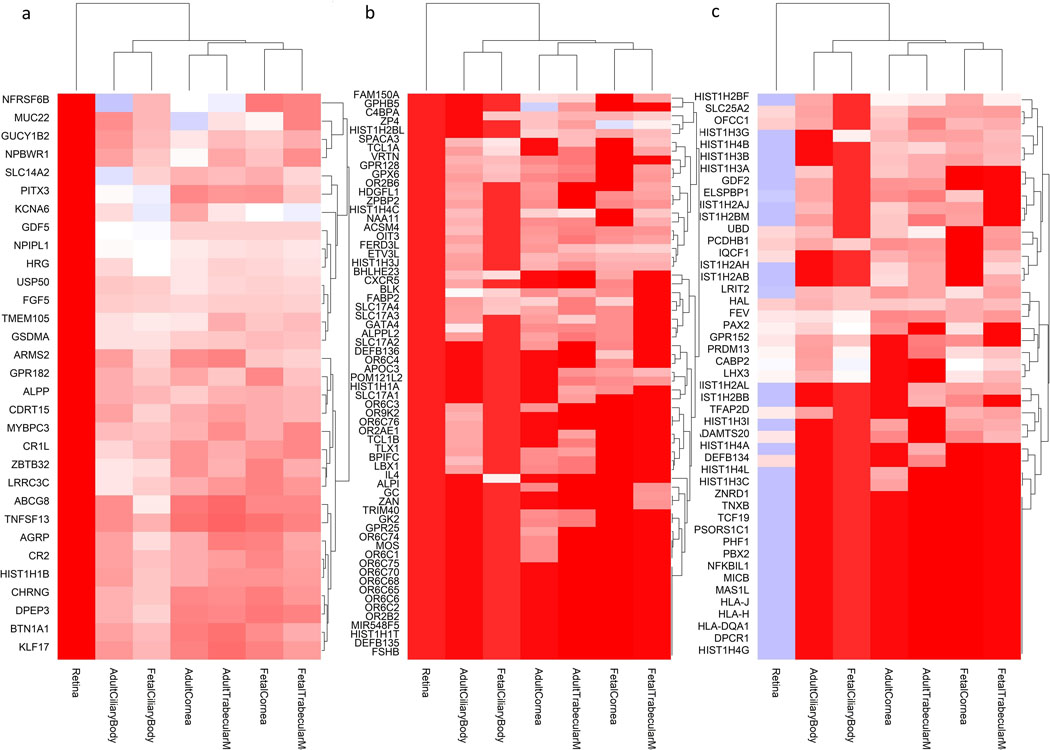
Extended Data Fig. 5:
Genes from the regions associated with RE (from Supplementary Table 3) that are particularly expressed in eye tissues, compared to non-ocular tissues. These clusters are those highlighted in Supplementary Figure 3, but for the sake of clarity they are shown in transposed orientation compared to the previous figure (here genes in the y-axis and eye tissues in the x-axis), but same color codes as before. The dendrograms represent the degree of similarity observed for both tissues and gene expressions. The clusters are given in the order in which they were clustered together, from left to right: A) genes that are expressed more in other ocular tissues (fetal and adult) but much less in the adult retina. B) genes that are highly expressed in the retina and other ocular tissues, and C) genes that are expressed in the retina, but less in the other ocular tissues tested.

