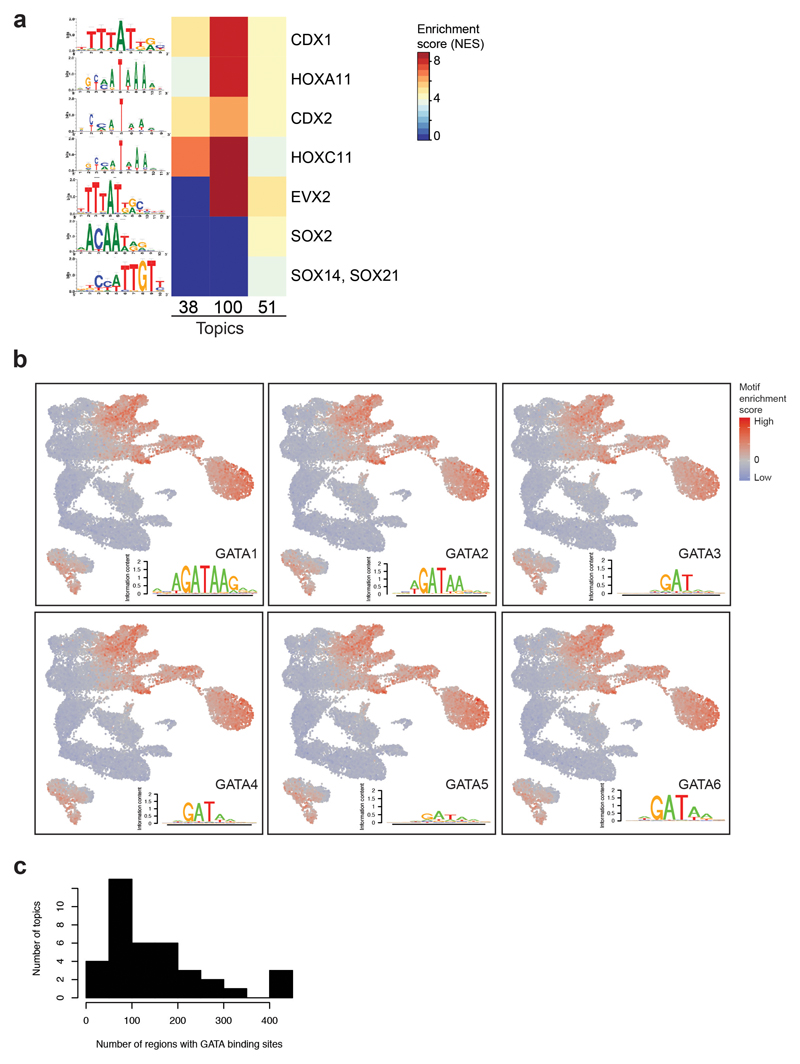
Extended Data Fig. 3. Transcription factor motif enrichment analyses.
a, Heatmap showing the motif enrichment scores (NES) for transcription factor (TF) motifs enriched in OCRs uniquely contributing to topics 38, 51 and/or 100. Values are represented by a colour gradient from dark blue (0) to dark red (8.9). Sequence logos are shown on the left. b, UMAP visualisation showing the motif enrichment scores for GATA1-6 using chromVAR on the 19,453 cells. Values are represented by a colour gradient from dark blue (low, below 0) to red (high, above 0). Cells with values of 0 are depicted in grey. Sequence logos for each member can be found at the bottom right corner of each plot. c, Histogram showing the number of regions containing GATA binding sites per topic.

