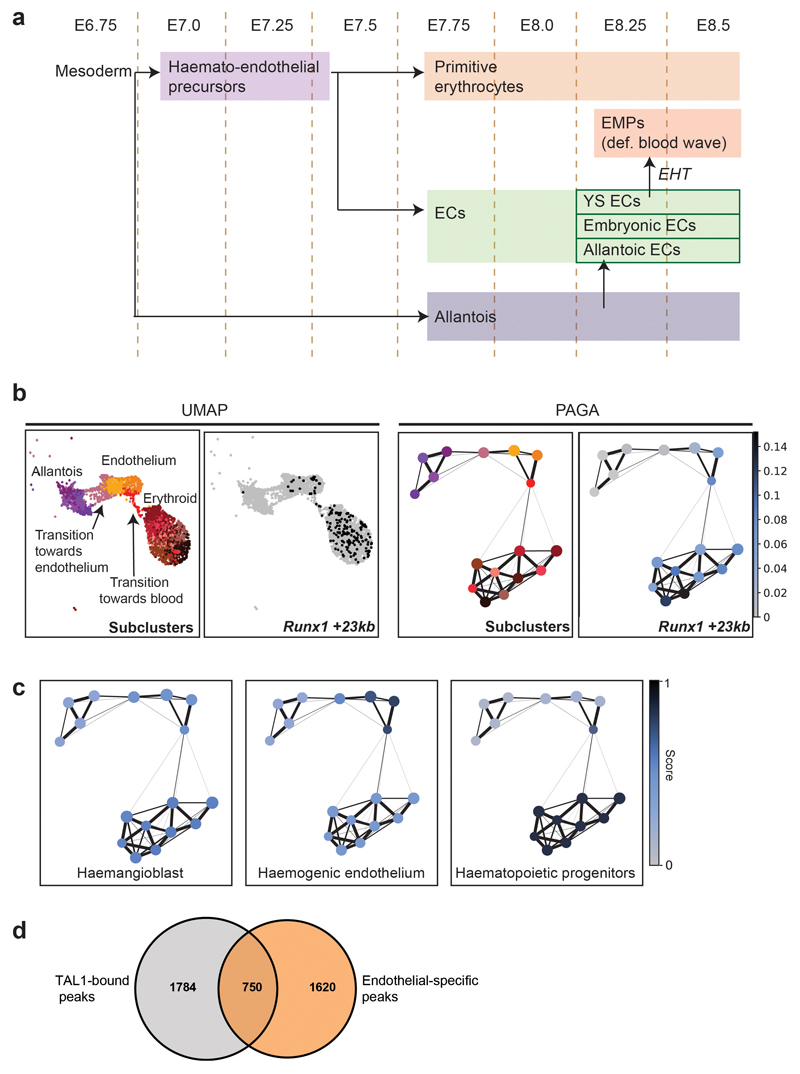
Extended Data Fig. 5. allantoic-haemato-endothelial development.
a, Simplified diagram of allantoic-haemato-endothelial development. Early mesoderm generates different lineages including allantoic cells, erythrocytes and endothelial cells (ECs). The precursors of the first wave of primitive erythrocytes express genes commonly associated with ECs, thus making the distinction between erythroid and endothelial precursors (Haemato-endothelial precursors) difficult by their transcriptomes. Yolk sac (YS) ECs give rise to the definitive blood wave by generating erythro-myeloid progenitors (EMPs). The allantois also contributes to the EC pool by generating allantoic ECs. b, UMAP visualisation (left) and PAGA representation as in Fig. 7a (right) of the allantoic-haemato-endothelial landscape (n=3,284 cells) showing the chromatin accessibility at the Runx1 +23kb enhancer. Black dots in UMAP on the right correspond to nuclei where the region is accessible. Accessibility in PAGA is represented by the ratio of nuclei per cluster (from grey to dark blue) that have Runx1 +23kb accessible. c, PAGA representation as in Fig. 7a showing the mean enrichment scores per cluster (from gray=0 to dark blue=1) for TAL1 ChIP-seq peaks from haemangioblasts, haemogenic endothelium and haematopoietic progenitors. Sub-clusters for PAGA have been defined in Fig. 7a. d, Venn diagram showing the number of endothelial-specific regions from the snATAC-seq dataset, the number of TAL1-bound regions obtained by ChIP-seq in haemogenic endothelial cells from32, and their overlap. ChIP-seq peaks were taken from http://codex.stemcells.cam.ac.uk/.

