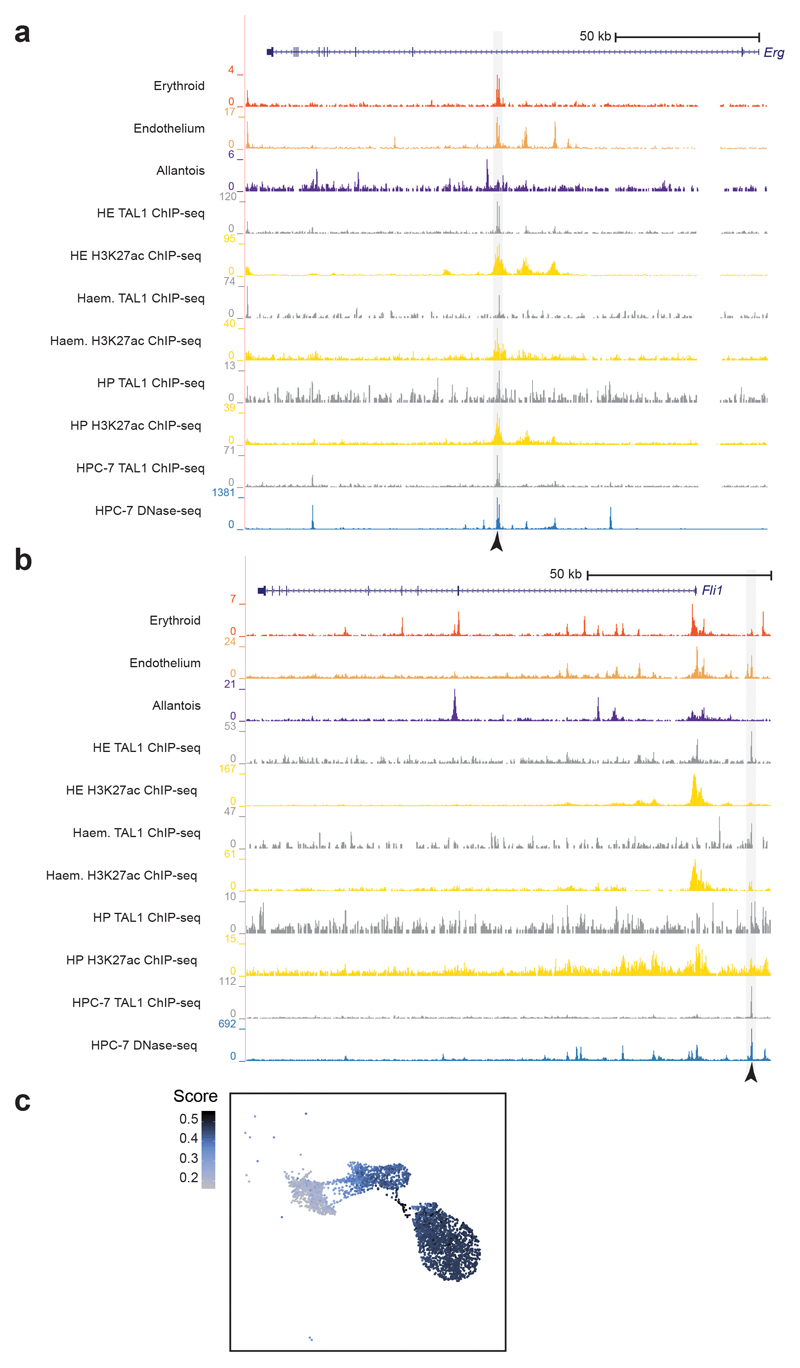
Extended Data Fig. 6. Erg +85kb and Fli1 -15kb enhancers.
a-b, Genome browser tracks showing the Erg (a) and the Fli1 (b) loci. Black arrowheads indicate the Erg +85kb (top) and the Fli1 -15kb (bottom) enhancers. Tracks correspond to the snATAC-seq profiles of the erythroid, endothelium and allantois cell types after cell pooling, TAL1 ChIP-seq for haemogenic endothelial cells (“HE TAL1 ChIP-seq”, grey), H3K27ac ChIP-seq for haemogenic endothelial cells (“HE H3K27ac”, gold), TAL1 ChIP-seq for haemangioblasts (“Haem. TAL1 ChIP-seq”, grey), H3K27ac ChIP-seq for haemangioblasts (“Haem. H3K27ac”, gold), TAL1 ChIP-seq for haematopoietic progenitors (“HP TAL1 ChIP-seq”, grey), H3K27ac ChIP-seq for haematopoietic progenitors (“HP H3K27ac”, gold) from32, TAL1 ChIP-seq for HPC-7 cells (“HPC-7 TAL1 ChIP-seq”, grey) and DNase-seq for HPC-7 cells (blue). Publicly available tracks were obtained from http://codex.stemcells.cam.ac.uk/. c, UMAP visualisation of the allantoic-haemato-endothelial landscape (n=3,284 cells) showing the enrichment score (from grey/low to dark blue/high) for HPC-7 TAL1 ChIP-seq peaks.

