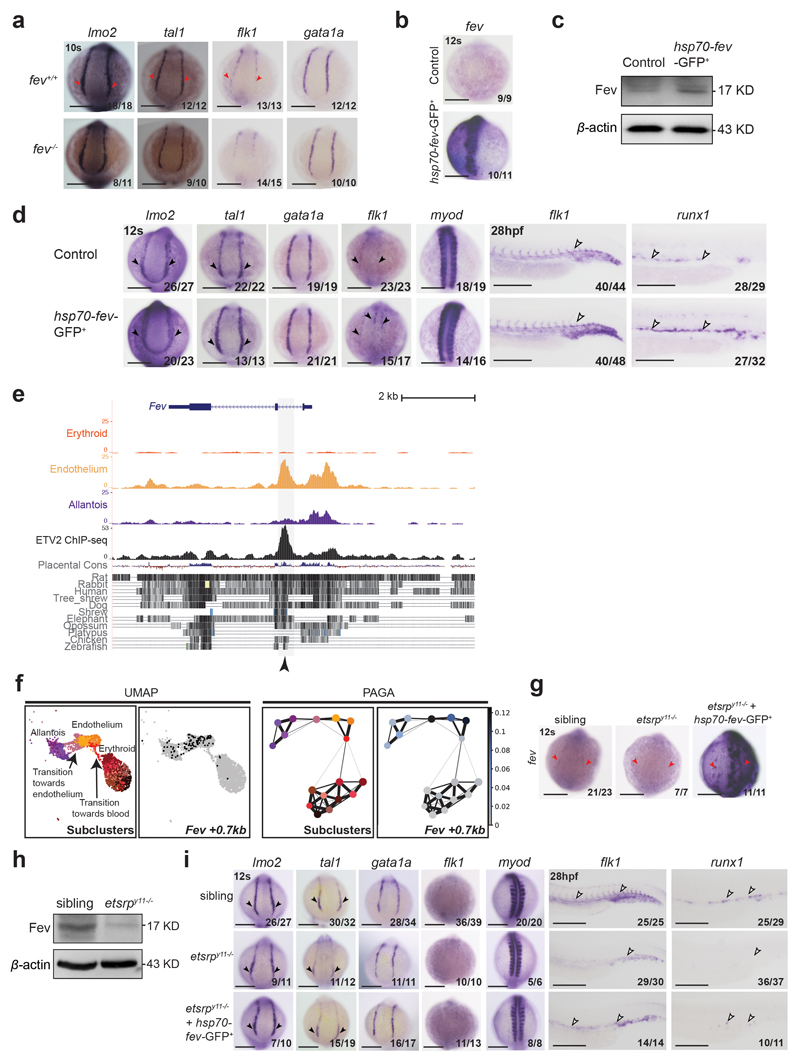
Extended Data Fig. 10. fev plays a role in haematopoietic and endothelial development.
a, WISH showing the expression of lmo2, tal1, flk1 and gata1a in fev mutants at 10s. Dorsal view, anterior to the top. Red arrowheads indicate increased expression in fev+/+. b, WISH showing that the expression of fev at 12s was increased hsp70-fev-GFP transgenic embryos after heat-shock at 3s. c, Western blot showing the protein level of Fev increased in hsp70-fev-GFP transgenic embryos compared to control at 12s after heat-shock at 3s. d, WISH of lmo2, tal1, gata1a, flk1, myod and runx1 in control embryos (top) and embryos injected with hsp70-fev-GFP and tol2 mRNA and heat-shocked at 3s (bottom). Black arrowheads indicate the expression (top) and expanded expression (bottom) in the PLPM. White arrowheads indicate expression (top) and expanded expression (bottom) in the trunk vessels. Embryos are shown on the dorsal view at 12s stage, and the lateral view at 28 hpf. e, Genome browser tracks showing the Fev locus. Black arrowhead indicates the Fev +0.7kb region accessible in endothelium and bound by ETV2 in vitro. Tracks correspond to the snATAC-seq profiles of the erythroid, endothelium and allantois cell types after cell pooling, the ETV2 ChIP-seq from41 and evolutionary conservation tracks from UCSC. f, UMAP visualisation (left) and PAGA representation (right) of the allantoic-haemato-endothelial landscape (n=3,284 cells) showing the chromatin accessibility at the Fev +0.7kb region. Sub-clusters are as in Fig. 7a. Black dots in UMAP on the right correspond to nuclei where the region is accessible. Accessibility in PAGA is represented by the ratio of nuclei per cluster (from grey to dark blue) that have Fev +0.7kb accessible. g, WISH analyses showing the expression of fev in PLPM from etsrpy11-/- mutants, and etsrpy11-/- mutants with hsp70-fev-GFP and tol2 mRNA under heat-shock treatment at 3s. Red arrowheads highlight the area where fev is reduced in etsrpy11-/- mutants and where it is ectopically expressed after heat-shock treatment. h, Western blot analysis showing the protein level of Fev in sibling and etsrpy11-/- mutants. i, WISH of lmo2, tal1, gata1a, flk1, myod and runx1 in sibling embryos (top), etsrpy11-/- embryos (middle), and etsrpy11-/- embryos co-injected with hsp70-fev-GFP and tol2 mRNA and heat-shocked at 3s (bottom). Black arrowheads indicate the expression (top), reduction of expression (middle) and expanded expression (bottom) in the PLPM. White arrowheads indicate these patterns in the trunk vessels. Embryos are shown on the dorsal view at 12s stage, and the lateral view at 28 hpf. Fractions in the panels with zebrafish images depict the number of embryos that showed similar results out of the total number of embryos analyzed. Full, unmodified Western blots corresponding to panels (c) and (h) can be found in the Source Data file corresponding to this figure. Scale bars: 200 μm.

