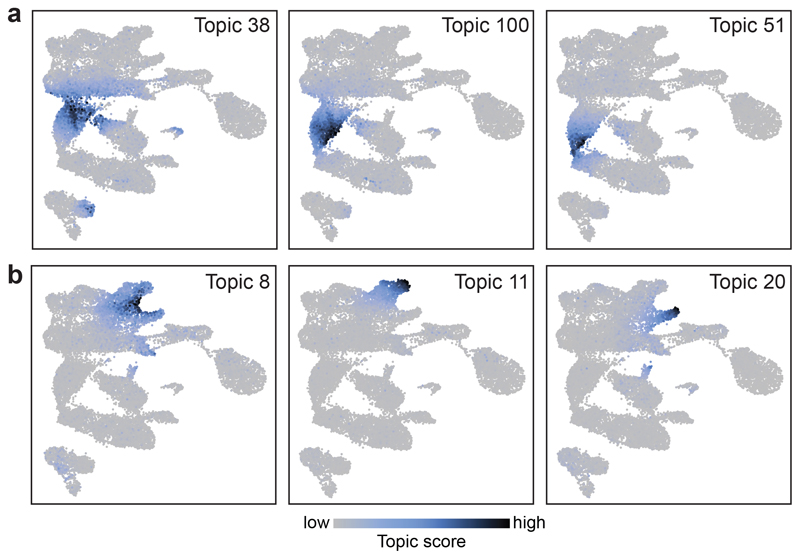
Fig. 2. cisTopic analysis reveals complex patterns including restriction to subpopulations and sharing between cell types.
a, UMAP visualisations (n=19,453 nuclei) showing the topic score per cell for topics contributing to subpopulations within the NMP cell type (n=1,926 cells). b, UMAP visualisations (n=19,453 cells) showing the topic score per cell for Topic 8, which contributes to both Mesenchyme (n=762 cells) and Cardiomyocytes (n=717 cells) (left); Topic 11, which contributes only to Mesenchyme (middle); and Topic 20, which contributes to Cardiomyocytes (right). Scale bar for (a) and (b) is shown at the bottom of the Figure. Low: grey. High: dark blue.

