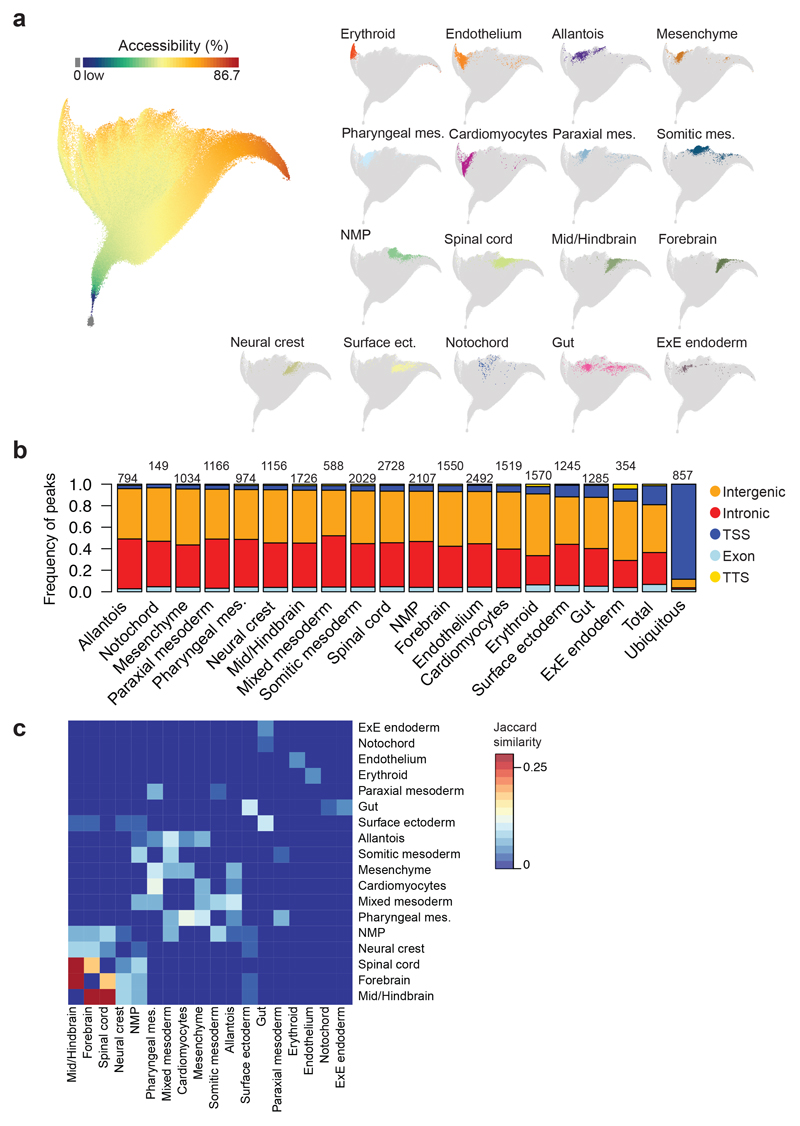
Fig. 4. Cell type-specific genomic regions are co-regulated.
a, UMAP visualisation of the dataset where each dot represents a genomic region and their position highlights how their accessibility varies across cells. n=305,187 genomic regions. Left: Genomic regions are coloured by the percentage of nuclei that have that specific region open that ranges from dark blue (low) to dark red (86.7%), with those genomic regions with 0% accessibility in grey. Colour scale has been log-transformed. Right: Only cell type-specific genomic regions are coloured. b, Barplot showing the frequency of genomic regions that fall in intergenic (orange), intronic (red), promoter-TSS (dark blue), exonic (light blue) and TTS (yellow) regions for each cell type. “Ubiquitous”: regions that are open in more than 25% of the nuclei. “Total”: all genomic regions (n=305,187). Numbers on top of the bars refer to the number of genomic regions specific for each cell type and for ubiquitous regions. c, Heatmap showing the degree of overlap (Jaccard similarity) between cell type-specific regions from different lineages. Jaccard similarity index ranges from 0 (dark blue) to 0.283 (dark red). Jaccard similarity was set to 0 in the diagonal. mes.: mesoderm. ect.: ectoderm. ExE: Extra-embryonic; NMP: Neuro-mesodermal progenitor.

