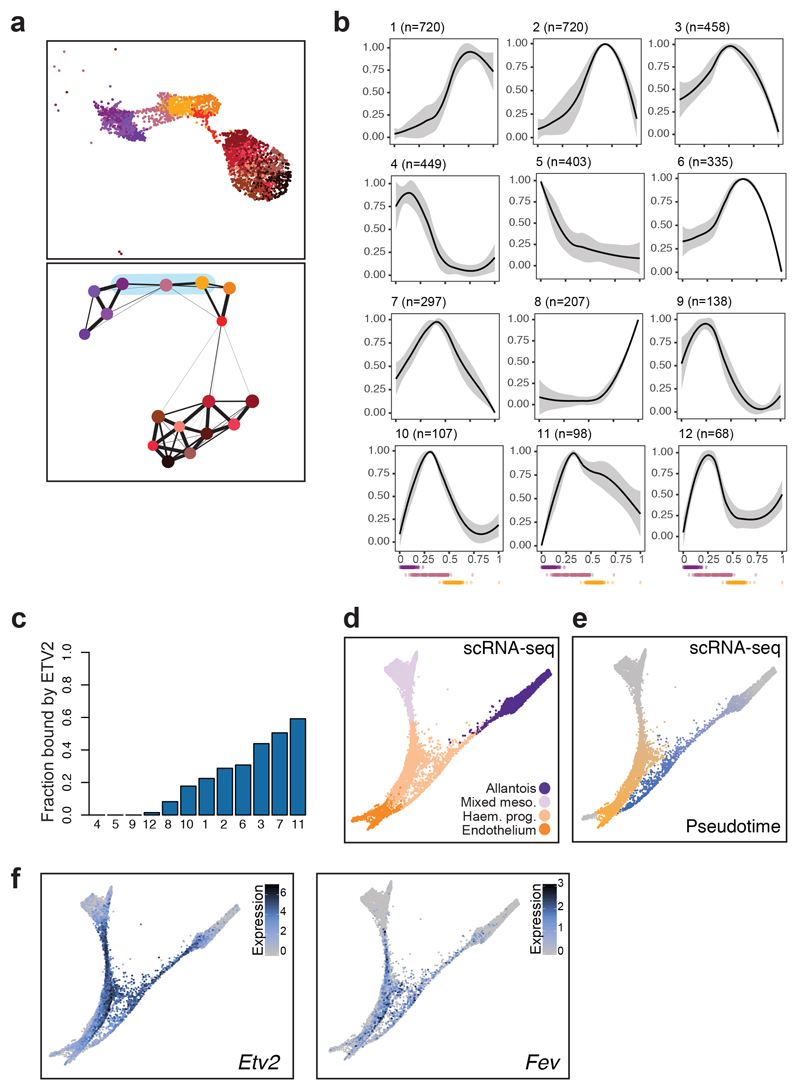
Fig. 7. Fev as a potential regulator of the endothelial program.
a, UMAP visualisation (top) and PAGA representation (bottom) of allantoic-haemato-endothelial cells (n=3,284 cells). Colours represent different sub-clusters. Blue shade in PAGA marks the clusters involved in the transition from allantois to endothelium and that were used for pseudotime analyses. b, Dynamic patterns of chromatin accessibility along the trajectory from allantois to endothelium. The black line is the mean fitted accessibility across all OCRs in each pattern; the grey shading indicates the standard deviation along the trend across all OCRs in the pattern. Dots below plots represent the ordered cells coloured by sub-clusters in (a). n=number of genomic regions that were assigned to the pattern. c, Barplot showing the fraction of peaks within each of the patterns in (b) that are bound by ETV2 in a published ChIP-seq dataset41. d-f, Force-directed graph showing cells from the “Mixed mesoderm”, “Allantois”, “Haemato-endothelial progenitors” and “Endothelium” that have been profiled with scRNA-seq in8 (n=7,631 cells). Cell colours in (d) represent the original cell types from8. Colour gradients in (e) show the pseudotime trajectories from mixed mesoderm to endothelium (from grey to orange) and from allantois to endothelium (from grey to blue). Cells coloured in grey were not considered for pseudotime analyses. Colour gradient in (f) indicate log2-normalised expression levels of Etv2 (left) and Fev (right).

