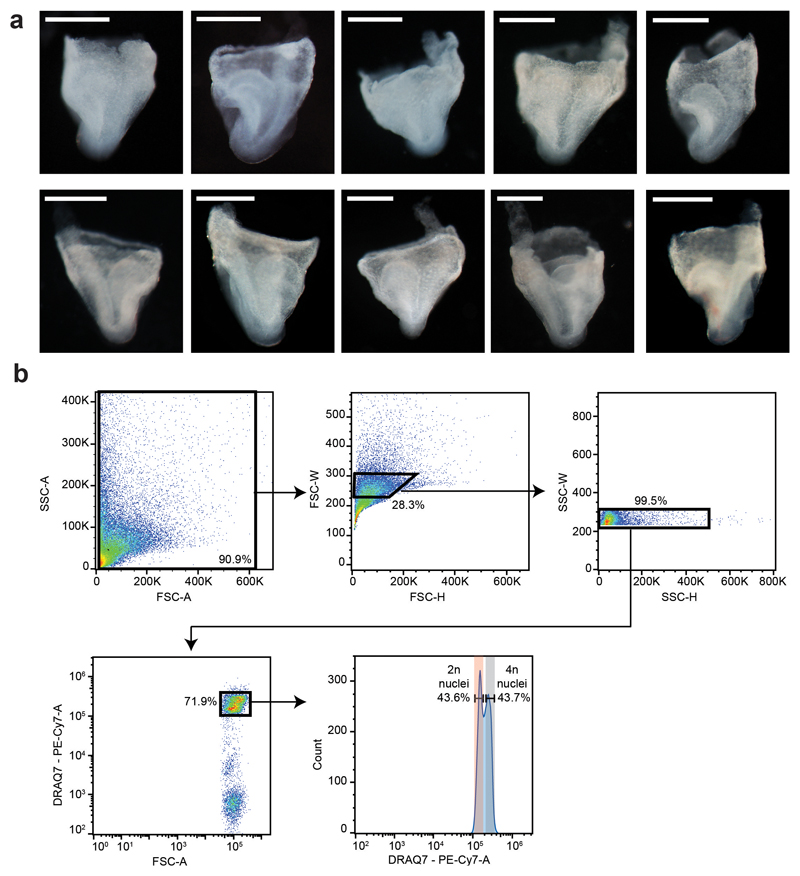
Extended Data Fig. 1. snATAC-seq experiment.
a, E8.25 embryos used for snATAC-seq. This panel includes the embryo in Fig. 1a (top right in this panel). Scale bar: 0.5mm. Experiment was performed with 10 embryos. b, Representative FACS gating strategy. The gate used to sort the nuclei regardless of DNA ploidy can be found in the bottom left panel. Gates for nuclei with 2 (2n) and 4 copies (4n) of DNA can be found in the bottom right panel.

