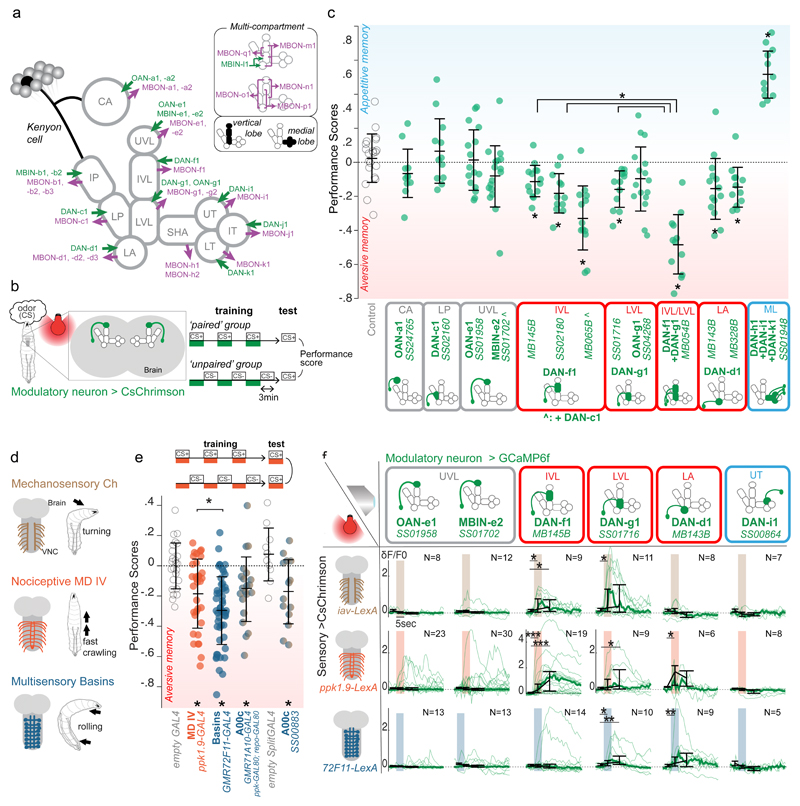
Figure 1. Individual vertical lobe DANs can induce aversive memory and represent different kinds of punishments in Drosophila larva.
a Schematic diagram of the larval MB compartments with an example KC, all MBONs and modulatory neurons.
b Schematic diagram of the one-odor associative memory optogenetic training protocol. Individual performance score is the difference between odor preferences of larvae after ’paired’ or ’unpaired’ protocol.
c Scores obtained with SplitGAL4-driven optogenetic activation of modulatory neurons in the training protocol shown in (b): Activating DANs of vertical (red) and medial (blue) lobe compartments induces aversive and appetitive memory, respectively. N=21,11,12,16,18,14,12,14,12,16,12,14,12,12 (see Supplementary SourceData_Figure1 for more details). Mean and standard deviations shown. *, **, ***, P<0.05, 0.01, 0.001, two-sided Mann-Whitney U test with Holm-Bonferroni correction in all legends unless otherwise stated.
d Different somatosensory neurons induce distinct innate escape responses23–25.
e Optogenetic activation of nociceptive neurons, Basins, or the Basin-target A00c induces aversive memory when paired with odor. (See Extended Data 2). N=25,33,52,21,14. Scores (computed as in b) are compared to the control group.
f ”Aversive DANs” respond to optogenetic activation of somatosensory neurons with specific tuning. Plots show calcium transients in selected modulatory neurons evoked by mechanosensory, nociceptive and Basin neurons activation. thin lines: averaged responses for one brain (3 repeats); thick lines: median across all animals. Black plots: median peak δF/F0 of individual curves in different time windows: 1 sec before, 1 sec during, and 2 sec following the stimulation. Error bars show the 25th and 75th percentile of peak δF/F0.

