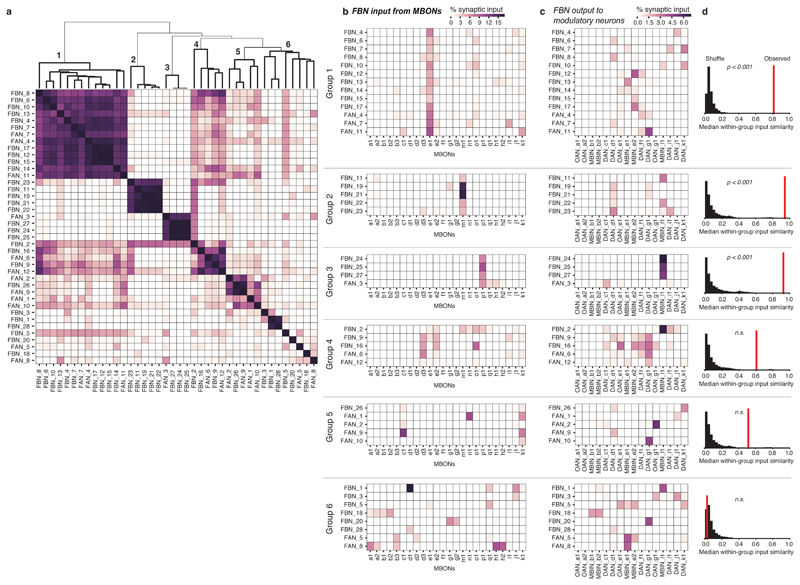
Extended Data Fig. 6. Clustering FBNs based on input from MBONs.
a Heat map of FBN similarity based on the pattern of FBN synaptic inputs from MBONs. The similarity between a pair of FBNs was computed as the cosine similarity between the vectors of their normalized synaptic inputs from all MBONs. Indices were ordered by agglomerative clustering with average linkage (dendrogram shown at top). We highlight six groups of FBNs defined by similarities in their input patterns (bold lines in dendrogram, numbered). b Heat maps showing patterns of input from MBONs onto FBNs for the input groups highlighted in a. In all cases, connectivity is measured in normalized synaptic input on the postsynaptic neuron. Most input groups receive dominant input from a single specific MBON (Groups 1,2, 5) or small group of MBONs (Groups 3 and 4), while Group 6 is not well-clustered and contains a variety of dissimilar input patterns. c Heat maps showing the patterns of synaptic output from FBNs to modulatory neurons for the input groups highlighted in a. d The observed similarity in the output patterns between FBNs within each group, compared to shuffled data. For each group clustered by input pattern, we computed the observed median of cosine similarity of the output vectors across all pairs of neurons (red line). In Groups 1,2, and 3, the neurons clustered by inputs had more similar output patterns than would be expected by chance. To determine significance, we compared the observed similarity to the distribution of the median cosine similarity for randomly permuted samples from the observed population of input vectors (black histograms, n=10000 randomized trials) with a one-sided permutation test. A Holm-Sidak correction was applied to p-values to correct for multiple comparisons. n.s.: p>0.05.

