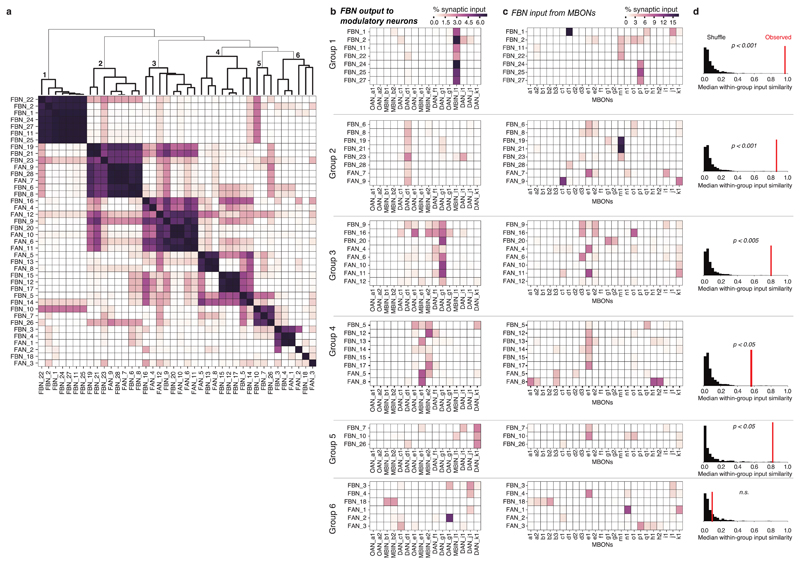
Extended Data Fig. 7. Clustering FBNs based on output onto modulatory neurons.
a Heat map of FBN similarity based on the pattern of FBN synaptic output across all modulatory neurons. The similarity between a pair of FBNs was computed as the cosine similarity between the vectors of normalized synaptic output onto all modulatory neurons. Indices were ordered by agglomerative clustering with average linkage (dendrogram shown at top). We highlight six groups of FBNs defined by similarities in their output patterns (bold lines in dendrogram, numbered). b Heat maps showing patterns of synaptic output from FBNs to modulatory neurons for output groups highlighted in a. Each group corresponds to several FBNs strongly targeting one or a small number of modulatory neurons, suggesting that some modulatory neurons are more strongly modulated than others. c Heat maps showing patterns of input onto FBNs from MBONs for the output groups highlighted in a. d The observed similarity in the input patterns between FBNs within each group, compared to shuffled data. For each group (as defined by output patterns), we computed the observed median of cosine similarity of the input vectors across all pairs of neurons (red line). In Groups 1–5, the neurons clustered by outputs had more input output patterns than would be expected by chance. To determine significance, we compared the observed similarity to the distribution of the median cosine similarity for randomly permuted samples from the observed population of input vectors (black histograms, n=10000 randomized trials) with a one-sided permutation test. A Holm-Sidak correction was applied to p-values to correct for multiple comparisons. n.s.: p>0.05.

