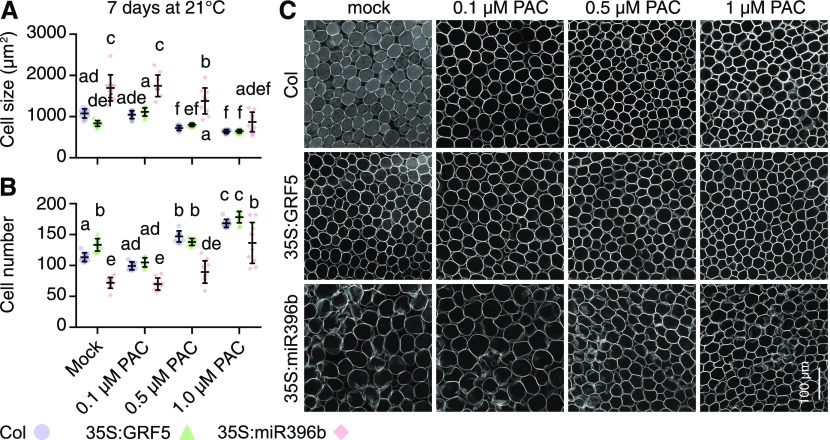
Figure 5.
Cell Size Is Differentially Sensitive to PAC Treatments in Different GRF Genotypes.
(A) and (B) Scatterplots of individual measurements (dots) of cell size (A) and cell number (B) from 400-µm × 400-µm photographs taken from the first two true leaves from 10 seedlings, as shown in (C). Also shown are means and sd of measurements from 10 different leaves. Data sets with no statistical difference after ANOVA and Tukey’s HSD posthoc test fall into one group and are labeled with identical letters.
(C) Representative images of leaf palisade cells underlying the adaxial epidermis in the middle region of the leaf from plants with the specified genotypes and grown on medium supplemented with the specified concentrations of PAC.

