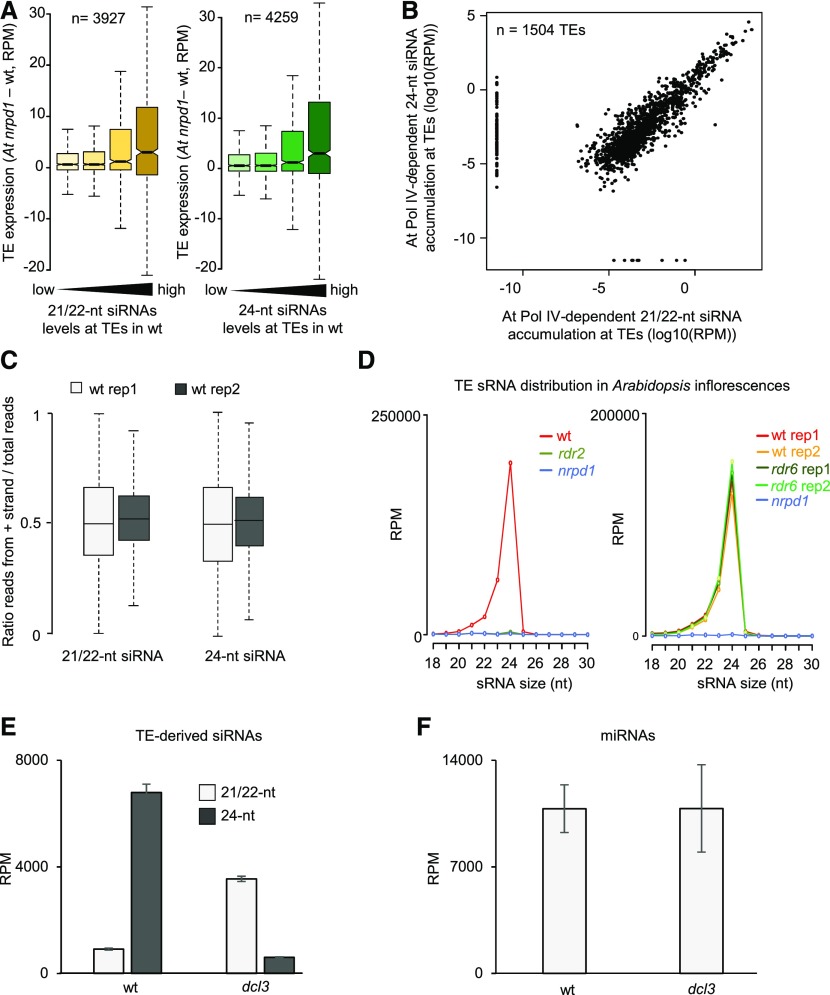
Figure 6.
Pol IV/RDR2 Generate Templates for 21- to 24-nucleotide siRNAs.
(A) Loss of Pol IV-dependent 21/22-nucleotide easiRNAs is associated with increased transcript levels of TEs in Arabidopsis microspores. Increasing accumulation of siRNAs over TEs is plotted from low to high levels of accumulation. The bars from low to high represent quartiles. In both plots, siRNA levels at TEs in the wild type (wt) increase from left to right in quantiles. Differences between the first and last categories are significant (P = 2.6e-10 and 1.5 e-14, respectively, Wilcoxon test). Boxes show medians and the interquartile range, and error bars show the full range excluding outliers. RPM, reads per million mapped reads.
(B) Abundance of At Pol IV-dependent 21/22-nucleotide siRNAs and 24-nucleotide siRNAs at TEs in Arabidopsis microspores. Values are indicated as log10 of the average RPM of both libraries. Each dot represents one TE for a total of 1504 TEs. A pseudocount of 0.0001 was added to all zero values. The correlation has been tested by a Spearman test (correlation coefficient of 0.7686).
(C) Plots showing the distribution of the ratio of the number of reads mapped against the positive strand to the total number of mapped reads. Left plots show analysis for 21/22-nucleotide reads and right plots for 24-nucleotide reads.
(D) TE-derived siRNA distribution in inflorescences of rdr2 (left panel; data from Zhai et al., 2015a) and rdr6 (right panel; data from Panda et al., 2016).
(E) Average total 21/22-nucleotide or 24-nucleotide reads mapping against TEs in wild-type or dcl3 libraries (data from Li et al., 2015). Reads were normalized to show RPM values. Errors bars represent sd of two biological replicates.
(F) Average total 21/22-nucleotide reads mapping against miRNAs in wild-type or dcl3 libraries (data from Li et al., 2015). Reads were normalized to show RPM values. Errors bars represent sd of two biological replicates.

