Figure 8.
Deregulated Genes Differ in Arabidopsis and Capsella nrpd1 Mutant Microspores.
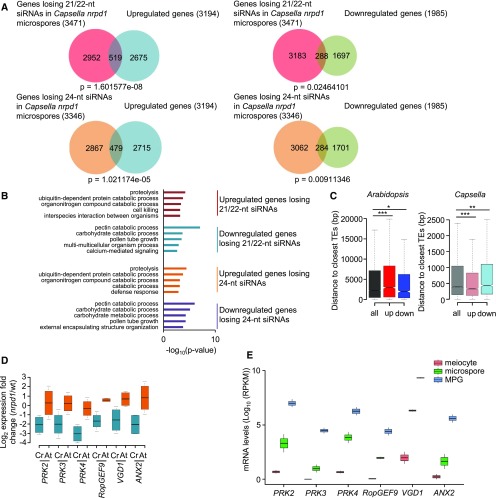
(A) Venn diagrams showing the overlap of deregulated genes (log2 fold change > 1, P < 0.05) in nrpd1 microspores of Capsella and genes losing 21/22-nucleotide and 24-nucleotide siRNAs at 2-kb upstream and downstream regions and gene bodies (log2 fold change < −1, P < 0.05) in Capsella nrpd1 microspores.
(B) Enriched GO terms for biological processes of intersected genes losing siRNAs and deregulated genes in Capsella nrpd1 microspores. The top 5 GO terms (P < 0.01) of each analysis are shown.
(C) Distance of Arabidopsis and Capsella genes to the closest TEs. all, all genes; down, significantly downregulated genes; up, significantly upregulated genes. *, P < 0.05; **, P < 0.01; ***, P < 0.001 (Wilcoxon test). Boxes show medians and the interquartile range, and error bars show the full range excluding outliers.
(D) Log2 expression fold change of PRK2, PRK3, PRK4, RopGEF9, VGD1, and ANX2 genes in nrpd1 microspores compared with the wild type (wt) in Capsella (Cr) and Arabidopsis (At). Boxes show medians and the interquartile range, and error bars show the full range.
(E) mRNA levels of PRK2, PRK3, PRK4, RopGEF9, VGD1, and ANX2 in Arabidopsis wild-type meiocytes, microspores, and mature pollen grain (MPG). +1 was added to all values to avoid negative log10 values. Boxes show medians and the interquartile range, and error bars show the full range. RPKM, reads per kilobase per million mapped reads.

