Figure 6.
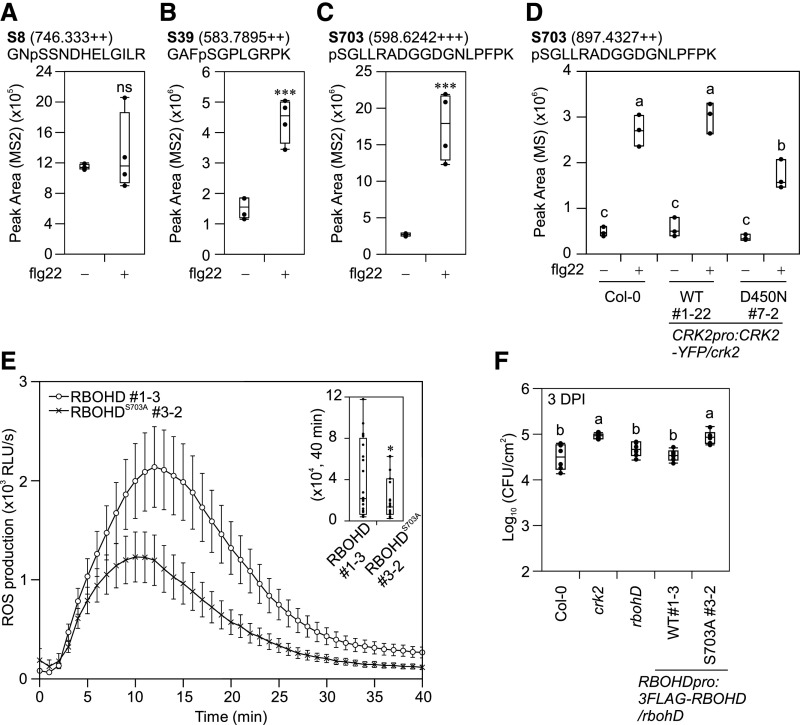
RBOHD S703 Is Involved in Regulation of flg22-Induced ROS Production.
(A) to (C) Quantification of RBOHD phosphorylation in Col-0 upon flg22 treatment. 12-d-old seedlings were treated with water (−) or 1 µM flg22 (+) for 5 min. Total proteins were digested with trypsin (S8 and S39) or Lys-C (S703) and phosphopeptides were enriched, and then selected phosphopeptides were quantified by LC-MS/MS. Box plots show MS2 fragment peak ion areas of indicated phosphopeptides (n = 4). Differences between water- or flg22-treated samples were evaluated with one-way ANOVA with Tukey-Kramer HSD, ***P < 0.001; ns, not statistically significant.
(A) RBOHD S8 residue.
(B) RBOHD S39 residue.
(C) RBOHD S703 residue.
(D) Quantification of RBOHD S703 phosphorylation in Col-0, CRK2pro:CRK2-YFP/crk2 #1-22, and CRK2pro:CRK2D450N-YFP/crk2 #7-2 upon flg22 treatment. Leaf discs from 28-d-old plants were treated with water (−) or 200 nM flg22 (+) for 5 min. Total proteins were digested with Lys-C and phosphopeptides were enriched, and then selected phosphopeptides were quantified by LC-MS/MS. Box plots show MS2 fragment peak ion areas of indicated phosphopeptides (n = 3). Each data point contains 14 leaf discs. Letters indicate significant differences at P < 0.05 (one-way ANOVA with Tukey-Kramer HSD).
(E) flg22-induced ROS production in RBOHDpro:3FLAG-RBOHD/rbohD #1-3 and RBOHDpro:3FLAG-RBOHDS703A/rbohD #3-2. Leaf discs from 28-d-old plants were treated with 200 nM flg22. Box plot shows cumulative ROS production over 40 min (top right). Values represent mean ± sem of n ≥ 23. Difference between lines was evaluated with one-way ANOVA with Tukey-Kramer HSD, *P < 0.05. The experiment was repeated three times with similar results.
(F) Quantitative analysis of bacterial growth in Col-0, crk2, rbohD, RBOHDpro:3FLAG-RBOHD/rbohD #1-3 and RBOHDpro:3FLAG-RBOHDS703A/rbohD #3-2 following spray inoculation with Pto DC3000 (1 × 10⁵ CFU/mL). Box plot shows the numbers of bacteria in leaf discs 3 d post-inoculation (3 DPI; n = 6). Each data point contains four leaf discs. Letters indicate significant differences at P < 0.05 (one-way ANOVA with Tukey-Kramer HSD).

