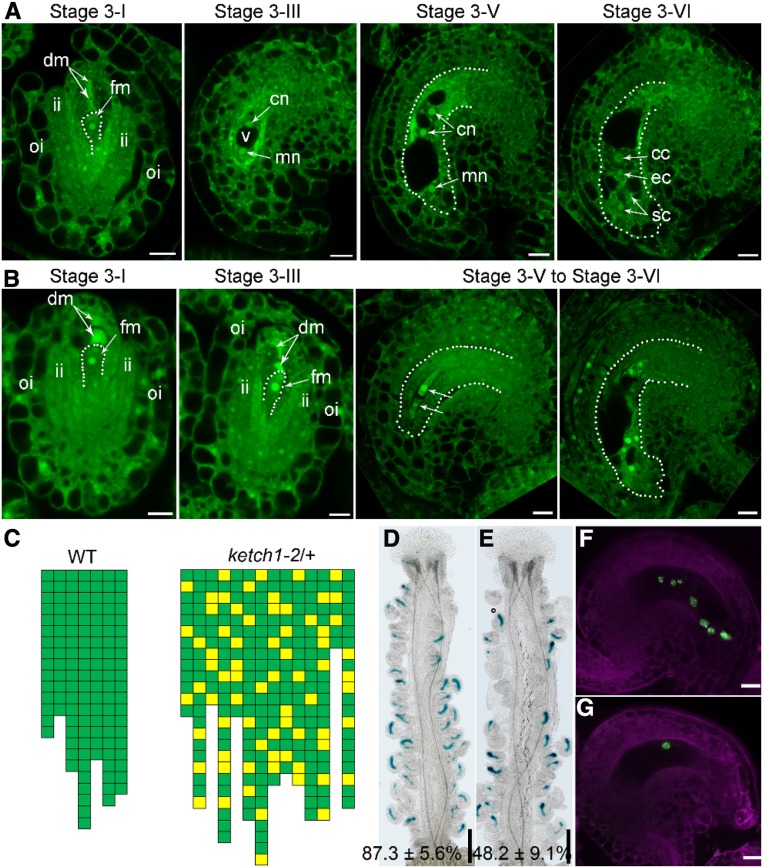
Figure 4.
KETCH1 Loss of Function Resulted in the Defective Development of Female Gametophytes.
(A) and (B) CLSMs of representative wild-type (A) or ketch1-2 (B) ovules during development. Dotted lines either illustrate functional megaspore (FM) of stage 3-I ovules or the embryo sac of ovules at other stages. cc, Central cell; cn, chalazal nucleus; dm, degenerating megaspore; ec, egg cell; fm, functional megaspore; ii, inner integument; mn, micropylar nucleus; oi, outer integument; sc, synergid cell.
(C) Quantification of embryo sac development based on CLSM of mature ovules. Each column represents one mature pistil; the number of cubes in each column indicates the number of countable ovules; green cubes indicate embryo sacs with normal seven-nucleus structure, whereas yellow cubes indicate abnormal embryo sacs as shown in (B). The positions of yellow squares indicate their positions in the pistils.
(D) and (E) Representative histochemical GUS staining of pistils from ProDD45:GUS (D) or from ProDD45:GUS;ketch1-2/+ transgenic plants (E). Values shown at the bottom (% of GUS-positive ovules) are means ± SD (n = 20). The ketch1-2/+ mutant is significantly different from wild type (t test, P < 0.05).
(F) and (G) Overlaid CLSM images of lysotracker red (magenta)-stained ProES1:NLS-YFP (F) or ProES1:NLS-YFP; ketch1-2/+ transgenic plants (G). Bars = 200 µm for (D) and (E); 10 µm for (A), (B), (F), and (G).

