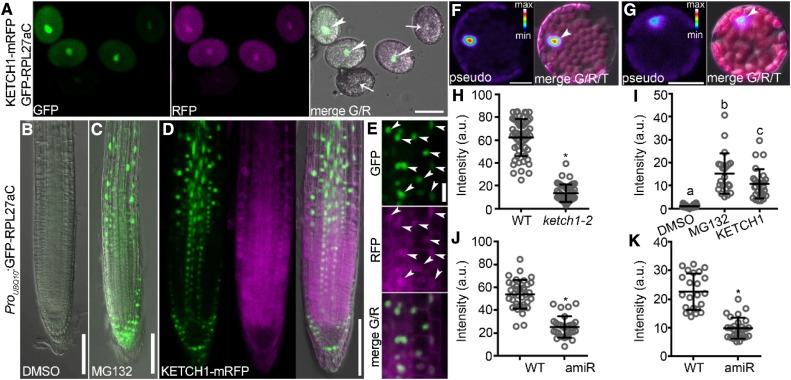
Figure 8.
KETCH1 Positively Regulates the Nuclear Accumulation of RPL27a.
(A) Pollen grains from the ProUBQ10:GFP-RPL27aC;ProUBQ10:KETCH1-mRFP/-;ketch1-2 plants. Arrowheads point at the nuclei of pollen grains expressing GFP-RPL27aC (green) and KETCH1-mRFP (magenta); arrows point at the nuclei of pollen grains with weak or undetectable signals of GFP-RPL27aC and KETCH1-mRFP. Images are Z-stacks of eight confocal sections.
(B) and (C) A representative primary root from the ProUBQ10:GFP-RPL27aC plants treated with either DMSO (B) or MG132 (C). The images shown are merges of the GFP and transmission channels.
(D) A representative primary root from the ProUBQ10:GFP-RPL27aC;ProUBQ10:KETCH1-mRFP plants. From left to right, CLSM of the GFP channel, the RFP channel, and merges of the GFP, RFP, and transmission channels. Confocal imaging of the GFP channel was performed with the same settings for (B) to (D).
(E) Closeup of the images in (D). From top to bottom, CLSM of the GFP channel, the RFP channel, and the merge of the GFP and RFP channels. Arrowheads point to the nuclei with both GFP and RFP signals.
(F) and (G) A leaf protoplast from the ProUBQ10:GFP-RPL27aC (F) or ProUBQ10:GFP-RPL27aC;Pro35S:amiR-KETCH1 plants (G). Confocal imaging was performed with the same settings. Left, CLSM of the GFP channel; right, the merge of the GFP channel, autofluorescence from chlorophyll, and the transmission channel. For GFP signals, intensities are represented in pseudo-color, covering the full range of measured values within each data set (min to max). Arrowheads point at the nuclei.
(H) Intensity of nuclear-associated GFP in pollen grains expressing both KETCH1-mRFP and GFP-RPL27aC (wild type [WT]) or those without clear RFP signals (ketch1-2).
(I) Intensity of nuclear-associated GFP in the ProUBQ10:GFP-RPL27aC transgenic roots, either treated with DMSO, with MG132, or coexpressing KETCH1.
(J) and (K) Intensity of nuclear-associated GFP in leaf protoplasts (J) or leaf abaxial epidermal cells (K) of the ProUBQ10:GFP-RPL27aC (WT) or ProUBQ10:GFP-RPL27aC;Pro35S:amiR-KETCH1 (amiR) transgenic plants. a.u. represents arbitrary fluorescence unit. Results in (H) to (K) are means ± SD (n > 23). Asterisks in (H), (J), (K) indicate significant difference (t test, P < 0.05). Different letters in (I) indicate significantly different groups (one-way ANOVA, Tukey’s multiple comparisons test, t < 0.05). Bars = 20 µm for (A), (E), (F), and (G), 100 µm for (B) to (D).

