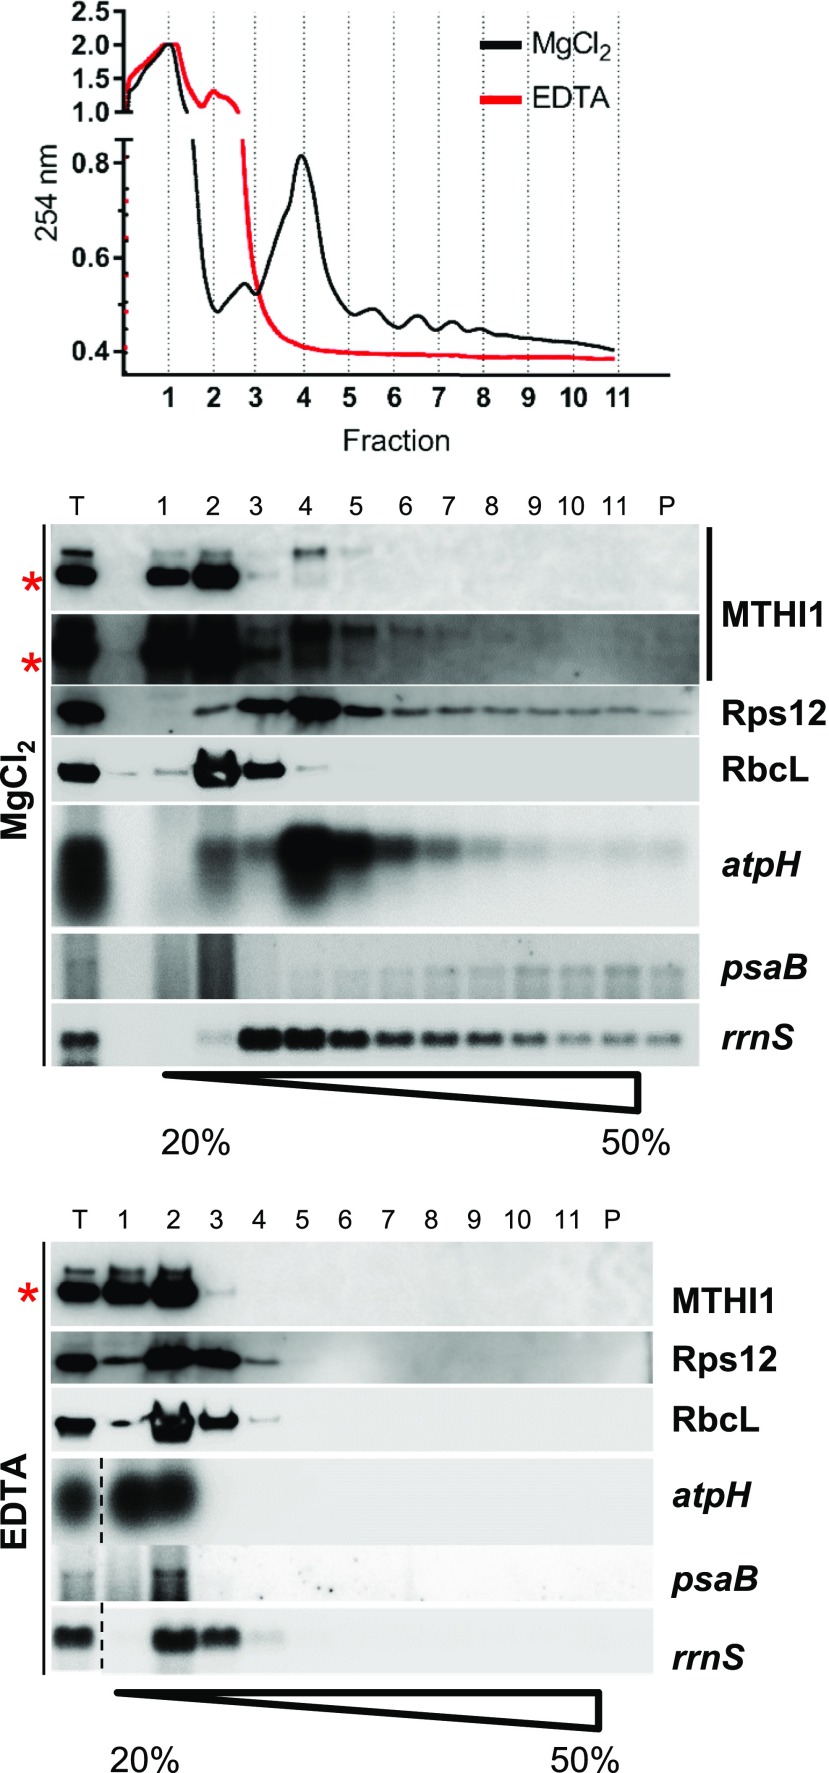
Figure 12.
MTHI1 Interacts with Polysomes.
The top panel shows the UV light absorbance profile along a Suc gradient, the middle panel shows the distribution of MTHI1, Rps12, and RbcL proteins and atpH, psaB, and rrnS (16S rRNA) transcripts in the wild-type cells, assessed by immunoblots, and the bottom panel shows the distribution of the same proteins and transcripts in samples treated with EDTA to dissociate the ribosomes. For the gradient in the presence of MgCl2, an overexposed blot immuno-decorated with the antibody against the MTHI1 protein is shown. T represents the total protein and RNA extracts. Note that atpH mRNA, encoding a short polypeptide, is not heavily loaded with ribosomes and does not penetrate deep in the gradient (red asterisk, cross-contamination).

