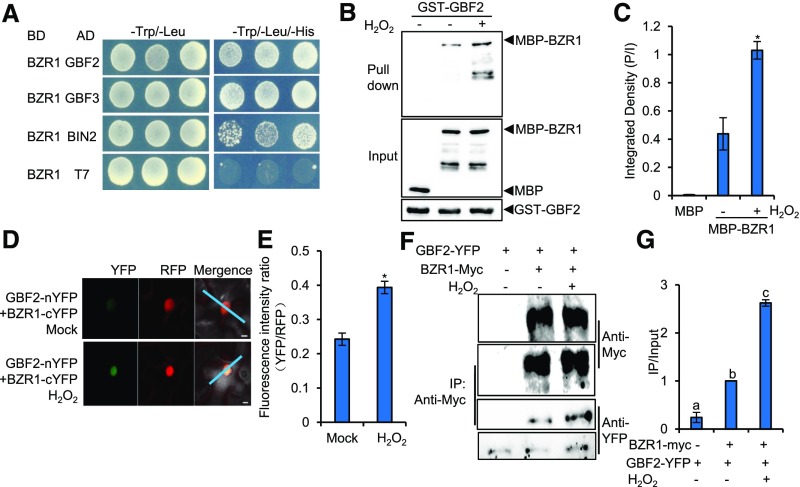
Figure 4.
H2O2 Enhances the Interaction between BZR1 and GBF2 in Vivo and in Vitro.
(A) BZR1 interacts with GBF2, GBF3, and BIN2 in yeast.
(B) and (C) In vitro pull-down assays showed that H2O2 enhanced the interaction between BZR1 and GBF2. Panel (C) shows the quantification of pull-down assays (normalized to input) displayed in (B). P/I, ratio of immunoblot image intensities between pull down and input. Error bars represent the sd of three independent experiments. *P < 0.05, as determined by a Student’s t test.
(D) and (E) H2O2 enhanced the interaction between BZR1 and GBF2 in tobacco leaves. (D) The fluorescent signals of YFP (BiFC) and RFP (reference) were determined along a line drawn on confocal images using ImageJ software. Error bars in (E) indicate sd (n = 100 images). *P < 0.05, as determined by a Student’s t test. Bar = 10 μm.
(F) and (G) H2O2 increased the interaction between BZR1 and GBF2 in plants. Plants expressing BZR1-Myc from the native BZR1 promoter and GBF2-YFP from the native GBF2 promoter or plants expressing only GBF2-YFP were treated with water (mock) or 100 μM H2O2 for 1 h before CoIP. The CoIP experiments were performed using Myc-Trap agarose beads, and the immunoblots were probed using anti-Myc and anti-YFP antibodies. Panel (G) shows the quantification of CoIP assays (normalized to input) displayed in (F). IP/Input, ratio of immunoblot image intensities between IP and input. Error bars represent the sd of three independent experiments. Different letters above the bars indicate statistically significant differences between the samples (one-way ANOVA followed by a post hoc Tukey test, P < 0.05). IP, immunoprecipitation.

