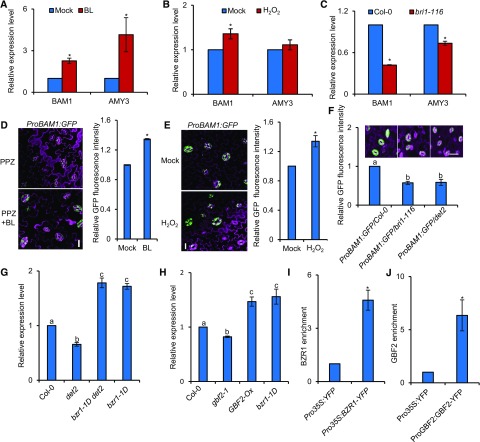
Figure 6.
BZR1 and GBF2 Directly Control BAM1 Expression.
(A) to (C) RT-qPCR analysis of the effects of BR and H2O2 on the expression of BAM1 in guard cell–enriched epidermal fragments of the 4-week-old wild-type Col-0 treated with or without 100 nM BL (A), 30 µM H2O2 (B) for 3 h, or in bri1-116 mutants (C). PP2A was used as an internal control. Error bars indicate sd of three biological repeats. *P < 0.05, as determined by a Student’s t test.
(D) Confocal images of ProBAM1:GFP in the epidermis of leaves. The ProBAM1:GFP transgenic plants were grown in half strength MS medium with 2 µM PPZ for 11 d and then treated with 80% ethanol solution (mock) or 100 nM BL for 3 h. GFP signal intensity was analyzed using ImageJ software. Error bars indicate sd (n = 100 images). *P < 0.05, as determined by a Student’s t test. Bar = 20 µm.
(E) Confocal images of ProBAM1:GFP in the epidermis of leaves of 4-week-old plants treated with or without 30 µM H2O2 for 3 h. GFP signal intensity was analyzed by ImageJ software. Error bars indicate sd (n = 100 images). *P < 0.05, as determined by a Student’s t test. Bar, 20 µm.
(F) Plants expressing the ProBAM1:GFP transgene displayed low GFP fluorescence signals in the Col-0, bri1-116, and det2 background. GFP signal intensity was analyzed using ImageJ software. Error bars indicate sd of three biological repeats. Differnt letters above bars indicate statistically significant differences between samples (one-way ANOVA followed by a post hoc Tukey test, P<0.05). Bar = 20 µm.
(G) and (H) RT-qPCR analysis of BAM1 expression in guard cell–enriched epidermal fragments of 4-week-old BR-related mutants (G) and GBF2-related plants (H). PP2A was used as an internal control. Error bars indicate sd of three biological repeats. Different letters above bars indicate statistically significant differences between samples (one-way ANOVA followed by a post hoc Tukey test, P < 0.05).
(I) and (J) ChIP-qPCR showed that BZR1 and GBF2 bind to the promoter of BAM1. ChIP was performed using GFP-Trap followed by qPCR analysis. The level of BZR1 or GBF2 binding was calculated as the ratio between BZR1-YFP or GBF2-YFP and the Pro35S:YFP control, normalized to that of the control gene PP2A. Error bars indicate sd of three biological repeats. *P < 0.05, as determined by a Student’s t test..

