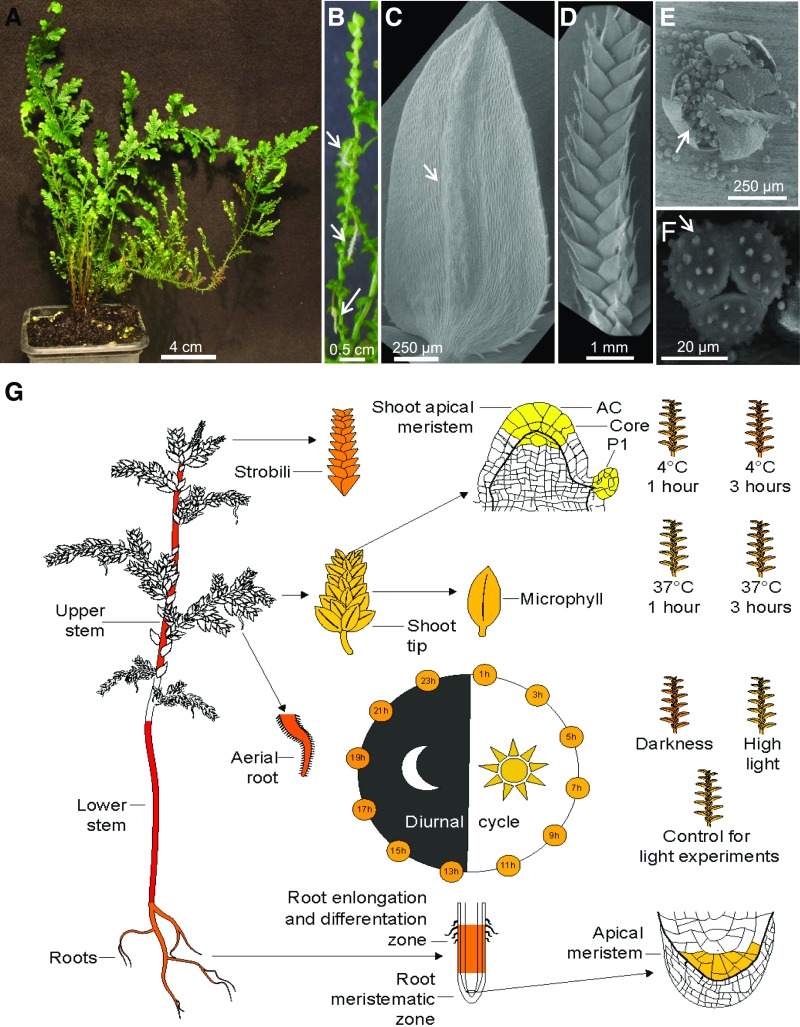
Figure 1.
Tissues and Organs Used to Generate the S. moellendorffii Expression Atlas.
(A) A typical S. moellendorffii plant used in this study.
(B) Stem with aerial roots (indicated by arrows).
(C) to (G) SEM images of Selaginella. (C) Microphyll, with the vein indicated by an arrow. (D) Strobilus. (E) Crushed microsporangium with released microspore tetrads. (F) Microspore tetrad, with three microspores shown. (G) Expression profile of the C3′H gene from S. moellendorffii (PACid_15423174) in Selaginella eFP Browser. Expression values in the sampled organs, stress, and diurnal conditions are indicated by a color gradient. Yellow indicates no detectable expression, while red signifies the highest expression.

