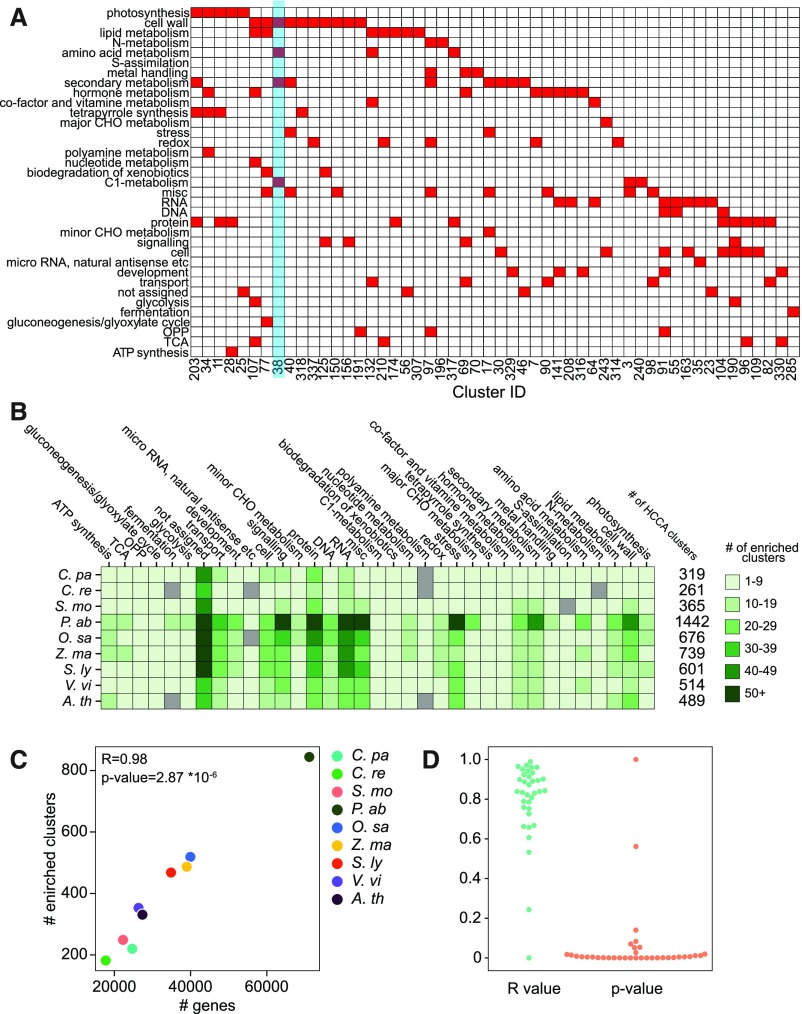
Figure 5.
Comparative Analyses of Biological Functions of the Coexpression Clusters.
(A) HCCA clusters of S. moellendorffii. The columns show cluster ID, while the rows correspond to MapMan bins that represent biological processes. Clusters enriched for a MapMan bin (FDR adjusted P value < 0.05) are indicated by red cells. Only 52 out of 365 clusters are shown in this figure, for brevity.
(B) The number of enriched bins found in the HCCA clusters of CoNekT-Plants species. The species are shown in rows, while the bins are indicated in the columns. The six shades of green indicate the number of clusters assigned to a bin.
(C) Relationship between the number of genes (y axis) and the number of HCCA clusters enriched for at least one MapMan bin (y axis) for each of the nine species in the CoNekT database (indicated by colored points). The Pearson r value and the resulting P value are indicated.
(D) Correlation between the number of genes assigned to a bin and the number of clusters enriched for the bin. Each point represents a MapMan bin. Blue points correspond to r values, while the orange points correspond to P values.

