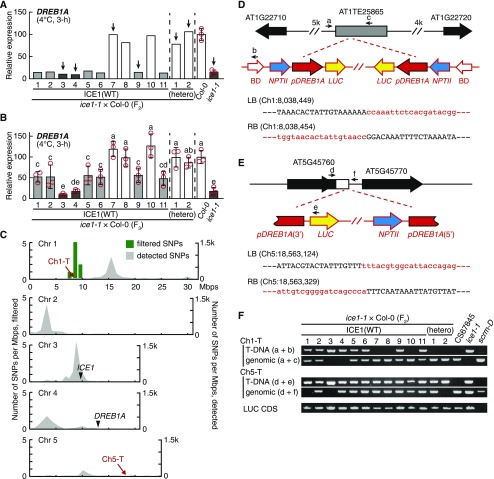
Figure 4.
Identification of the NICE1 Locus.
(A) Cold-induced expression of DREB1A in the F2 progeny of an ice1-1 × Col-0 cross. The lines indicated with arrows were used for genome resequencing.
(B) Cold-induced expression of DREB1A in the bulked F3 progeny (six to eight seedlings) of the F2 individuals in (A). The white, light gray, and dark gray bars indicate null segregants and heterogeneous and homogenous mutants of NICE1, respectively. The transcript level of each gene was measured by RT-qPCR. The bars refer to means ± sds; experiments were performed in triplicate. The different letters above the bars designate significant differences (two-tailed t test with Bonferroni–Holm correction, P < 0.05; Supplemental Data Set).
(C) Chromosomal distribution of SNPs and genetic loci related to DREB1A repression in ice1-1. The gray fills and green bars refer to the numbers of SNPs detected in total and of SNPs with perfect association with DREB1A repression in a bin (Mbp), respectively. The approximate loci of the ICE1 and DREB1A genes and of the two discovered T-DNAs (Ch1-T, Ch5-T) are given. Chr, chromosome.
(D) and (E) Schematic view of the Ch1-T (D) and Ch5-T (E) loci. The gray bar and open arrows indicate the TE and genes, respectively. The primer sets and positions for confirming the T-DNA insertion are shown with small black arrows (a to f). BD, T-DNA border; LB, T-DNA left border; RB, T-DNA right border.
(F) Genotypes of the two transgenes in the F2 individuals from the ice1-1 × Col-0 cross in (A). LUC CDS refers to amplification of the transgenic luciferase coding DNA sequence.

