Figure 2.
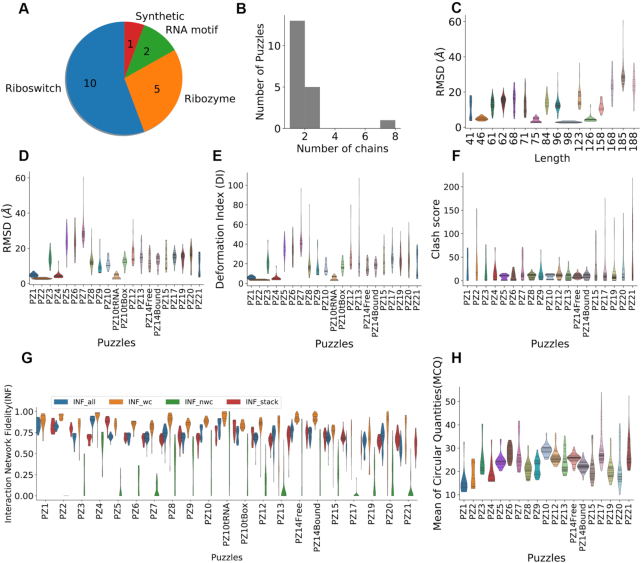
The structure diversity and comparison of the dataset. (A) The dataset is composed of 18 Puzzles of different types of RNA. (B) Most of them are one-chain or two-chain structures, except Puzzle 2 is of eight chains. (C) Correlation plot between the lengths of RNAs and the RMSD distributions, shown as violin plots, indicates that shorter RNA structures tend to be easier to predict. The RMSD, deformation index and clash score are shown in (D–F). The distributions of Interaction Network Fidelities are shown in (G), including stacking interactions (INF stacking), Watson-Crick interactions (canonical) (INF wc), non-Watson-Crick interactions (non-canonical) (INF nwc) and all interactions (INF all). MCQ assesses structure similarity based on torsion angles (H).

