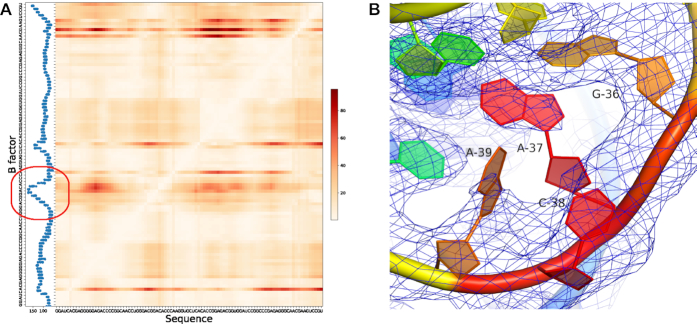
Figure 4.
Deformation Profile comparison between predicted structure and reference structure. (A) Deformation Profile heatmap aligned with average B factor histogram, showing the Puzzle 8 (6) solution structure (PDB ID: 4L81) compared to the model 3 predicted by Das lab. (B) Electron density map of the high B factor region, G36–A39, shown in the red circle region in (A). This region is highly mobile, while A37 and A39 do not have a full density in the 2fo – fc electron density map to support the coordinates proposed by the crystal structure.

