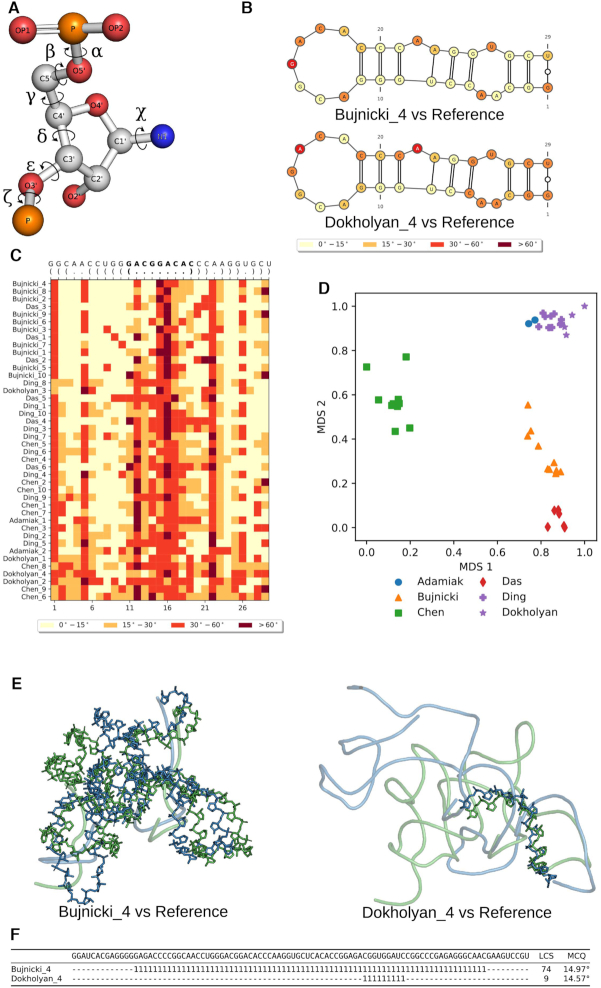
Figure 5.
MCQ and LCS-TA assess structure similarity in torsion angle space. MCQ and LCS-T compare structures based on (A) torsion angles defined for RNA structure. (B) MCQ supports assessing torsion angle-based similarity on a residue level and allows to visualize the results on the secondary structure diagram (here P3 stem characteristic to SAM-I/IV structures predicted in model 4 by Bujnicki lab (top) and Dokholyan lab (bottom) has been compared to the target fragment in Puzzle 8 (6)). (C) Heatmap shows the results of MCQ for the same P3 stem with PK-2 residues in bold, computed for all models submitted in Puzzle 8 and sorted by rank in reference to the target. (D) Clustering (colors) and visualization of models by different groups (markers) in Puzzle 8 upon MCQ distance matrix. LCS-TA finds structure fragments with torsion angle similarity threshold. (E) The resulting backbone fragment for LCS-TA in sequence-dependent mode with a threshold equal to 15° for model 4 (blue) by Bujnicki lab (left) and Dokholyan lab (right) aligned with the target (green) in Puzzle 8 and (F) positions of two LCS-TA-identified fragments marked with ‘1’ inserted in the appropriate places of the sequence, while unaligned regions are marked as ‘−’.

