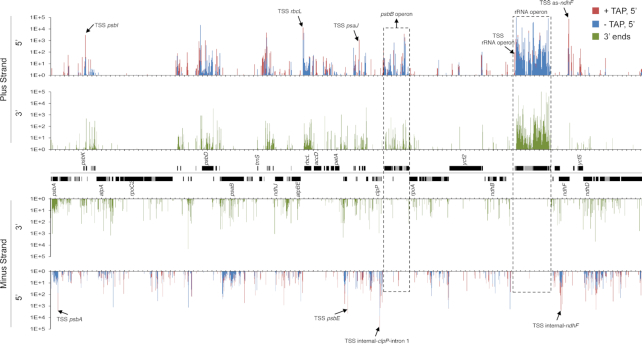
Figure 1.
Plastome-scale view of Terminome-seq results End coverages are the average of two Col-0 biological replicates and given in RPM. 5′ ends obtained with or without TAP treatment are red and blue, respectively, and 3′ ends are displayed in green. Gene models are indicated between the tracks corresponding to the plus and minus strands of the plastome. One copy of the large inverted repeat is omitted for clarity. Selected TSS described in more detail in the main text are marked by arrows and labeled, as are the psbB and rRNA operons. Tick marks are every 1000 nt.

