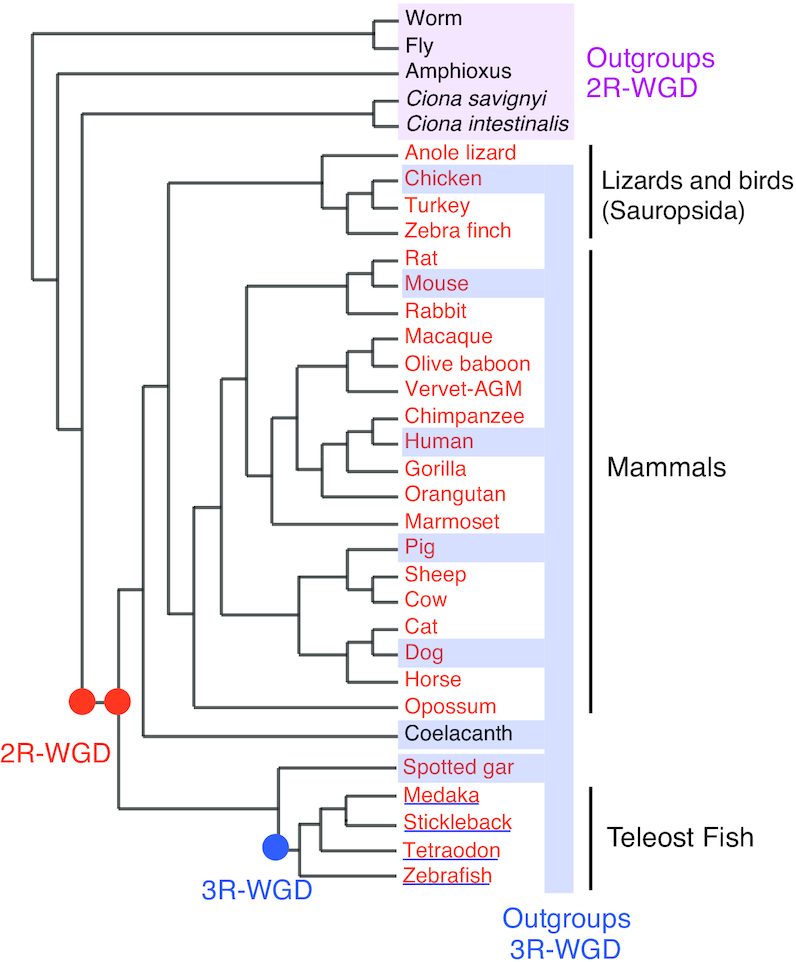
Figure 1.

A schematic phylogeny (not scaled) of the organisms in the OHNOLOGS v2 database. Vertebrates analysed for 2R-WGD are in orange, and teleost fish species analysed for 3R-WGD are underlined. Outgroup species used to identify 2R- and 3R-ohnologs have been highlighted.
