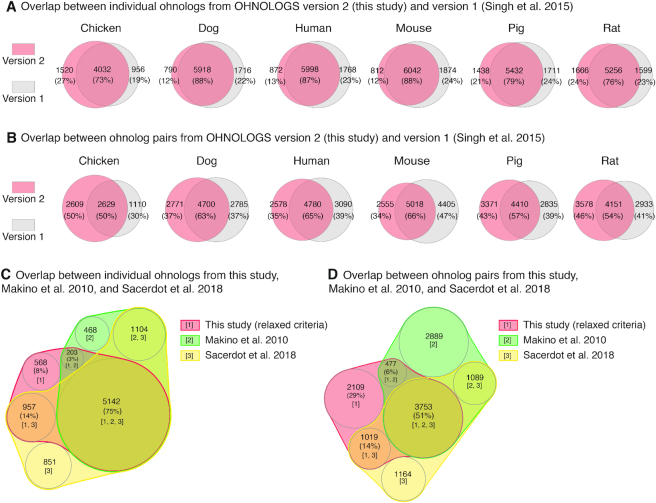
Figure 4.
Comparison of ohnologs across different studies. (A) Comparison of individual ohnologs from OHNOLOGS v2 (this study) with v1 (34) for the six vertebrates already included in v1. (B) Comparison of ohnolog pairs from OHNOLOGS v2 (this study) and v1 (34). The majority of individual ohnologs and pairs are shared between both versions. (C) Overlap among individual ohnologs from this study, Makino etal. (24) and Sacerdot etal. (41). (D) Overlap among ohnolog pairs from this study, Makino etal. (24) and Sacerdot etal. (41). The majority of individual ohnologs and pairs are shared across the three studies. The venn diagram between three sets have been generated using nVenn (42).

