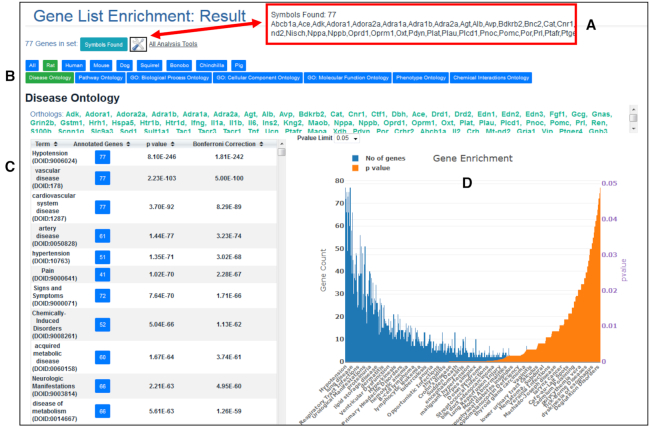
Figure 2.
MOET: the Multi Ontology Enrichment Tool Result Page. Seventy seven rat genes annotated to hypotension in RGD were submitted to the MOET tool. The result page shows the number of genes that matched the input list of symbols and when the ‘Symbols Found’ button is clicked, the popup shows the list of gene symbols (A). This same list of genes can be submitted to other tools at RGD using the ‘All Analysis Tools’ link. Click on the tabs across the top of the page to switch the display between species and/or between ontologies. Here, the default selections of ‘Rat’ and ‘Disease Ontology’ have been made (B). The table on the left side of the display shows the enriched terms with the number of genes annotated to each term, its P-value and its Bonferroni corrected P-value. The default is to show terms sorted by P-value but options are given to sort on any of the columns in the table (C). The graph on the right side of the display shows the number of genes annotated to each term in blue and the corresponding P-values in orange. The P-values displayed in the graph are limited to 0.05 or less by default but a dropdown at the top of the graph allows the user to change this value (D).

