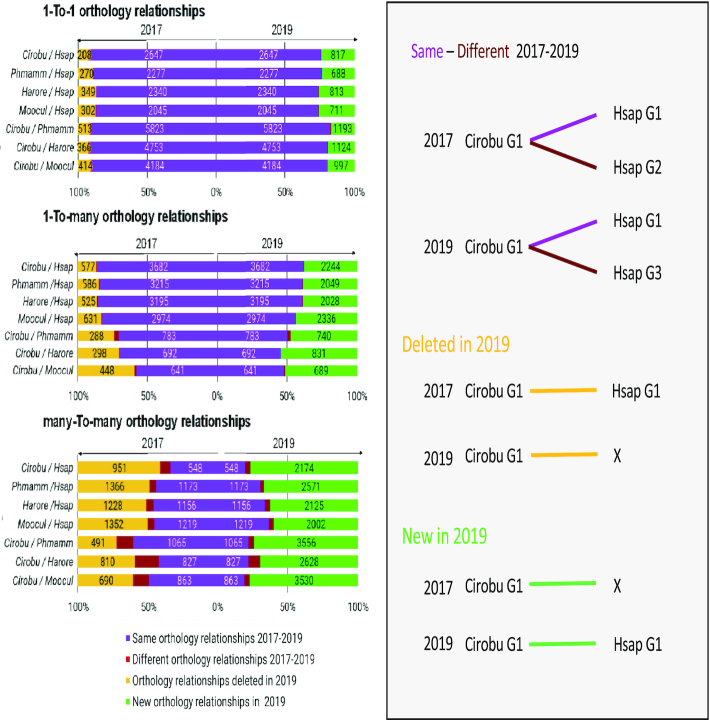
Figure 2.
Comparison of the one-to-one, one-to-many and many-to-many orthology relationships detected across the whole genome in the ANISEED 2017 and 2019 releases. Each half of the bar graphs present the analysis in 2017 (left half) and 2019 (right half) of the percentage (and number) of orthology relationships linking one Ciona robusta (Cirobu) gene to one gene in the second species indicated (Phmamm: Phallusia mammillata; Harore: Halocynthia roretzi; Moocul; Molgula oculata; Hasp: Homo sapiens). Four scenarios are distinguished, as illustrated on the right side of the figure. Same orthology relationships 2017–2019: orthology relationships found with both the 2017 and 2019 orthology pipelines. Different orthology relationships 2017–2019: the Cirobu gene has orthologs in the second species according to both pipelines, but these orthologs differ. New orthology relationships in 2019: 2019 orthology relationships linking a Cirobu gene, without 2017 ortholog in the second species, to one or more orthologs in this species. A minority of these cases (e.g. 35 in Cirobu/Hsap one-to-one) correspond to orthology relationships for Cirobu NCBI gene models that were added to complement the KH gene model set. Deleted orthology relationships in 2019: 2017 orthology relationships linking a Cirobu gene, without 2019 ortholog in the second species, to one or more orthologs in this species.

