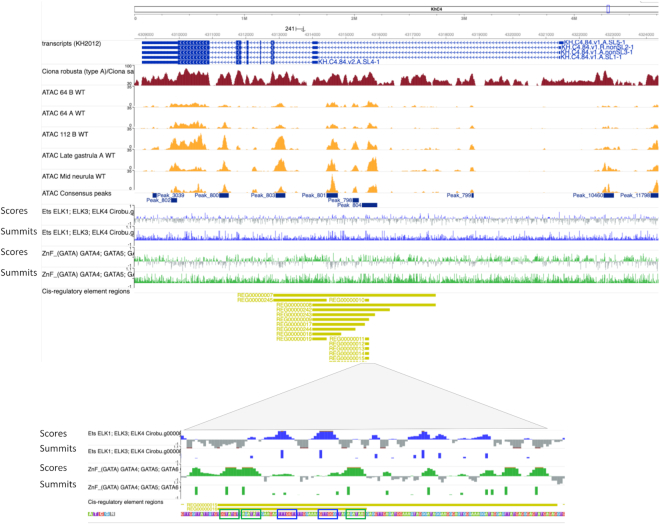
Figure 3.
Visualization of in silico predicted transcription Factor binding sites based on SELEX-seq data at the Otx (KH.C4.84) locus in Ciona robusta. The top panel provides a global view of the organization of the locus, including exon positions, chormatin accessible regions, and TF-binding predictions. The bottom panel is an enlarged view of the Otx a-element (REG00000010), a short enhancer activated by ETS and GATA4/5/6 factors (35) through two ETS sites (blue boxes) and three GATA sites (green boxes). ‘Score’ indicated a continuous scoring of predicted affinity. ‘Summits’ associate the highest score of each peak to its summit base.

