
Figure 4.
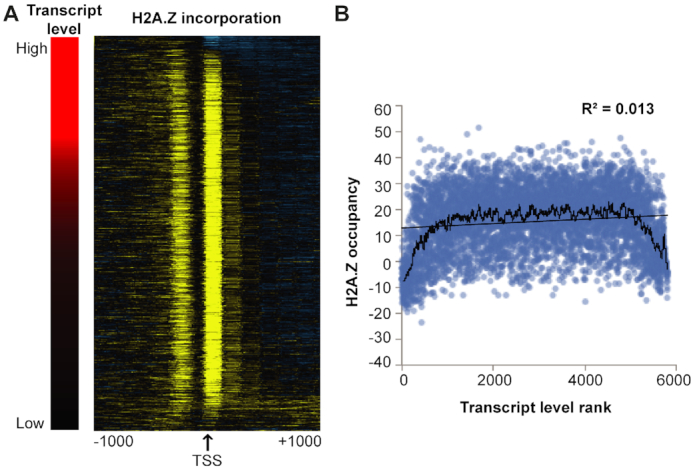
H2A.Z incorporation at the +1 nucleosome does not correlate with gene expression. (A) Heat map displaying H2A.Z incorporation across gene TSS regions (right) when sorted by transcript level as measured by read counts mapping to a transcript, normalized by transcript length (left). The H2A.Z occupancy data on the right is sorted according to the ranked transcript levels on the left. (B) H2A.Z occupancy at the +1 nucleosome plotted against ranked gene expression values. Ranking was used to accommodate outliers that would otherwise skew the plot. The black line represents a 50-gene moving average of H2A.Z occupancy levels.