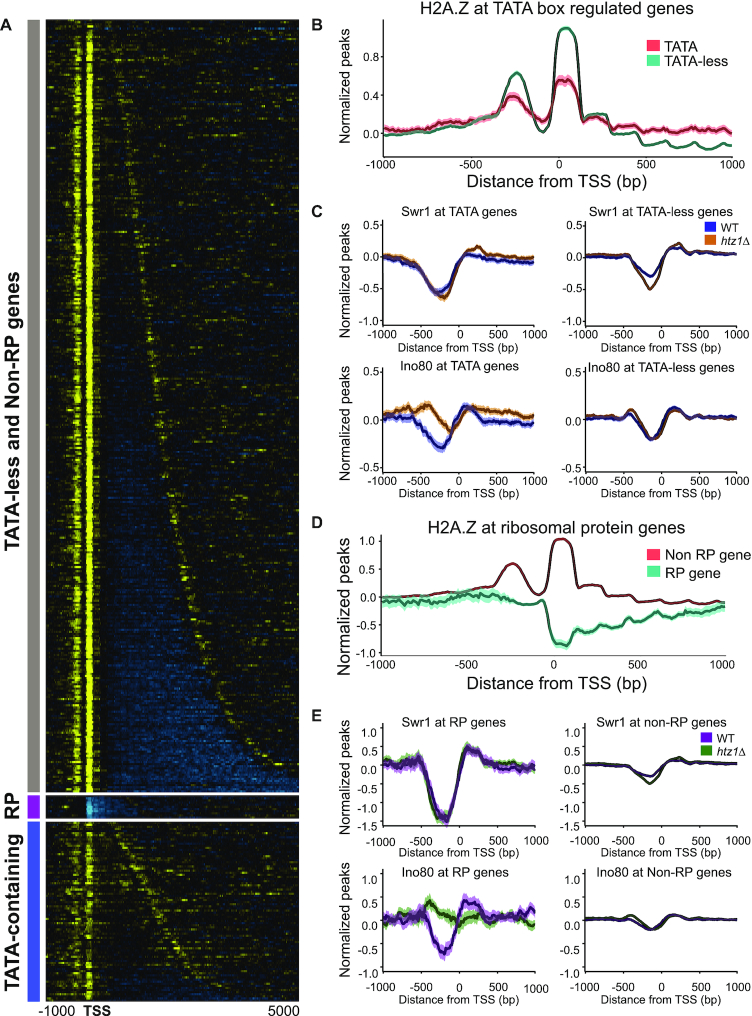
Figure 7.
H2A.Z localization at the TSS with respect to the TATA box and at ribosomal protein genes. (A) Heatmap of H2A.Z localization at genes with TATA-less promoters, ribosomal protein (RP) genes, and TATA box-containing genes. Six RP genes also have TATA boxes in their promoters, but their H2A.Z occupancy pattern is similar to the other 130 RP genes. (B) Average H2A.Z levels across TATA-containing and TATA-less genes. Genes with TATA boxes show lower +1 and −1 nucleosome incorporation of H2A.Z, but also display increased H2A.Z levels in the gene body. (C) Swr1 and Ino80 binding levels at TATA-containing and TATA-less genes in WT and htz1Δ background strains. (D) Average H2A.Z occupancy levels across RP and non-RP genes. RP genes are strongly depleted for H2A.Z. (E) Swr1 and Ino80 binding levels at RP and Non-RP genes in WT and htz1Δ background strains.

