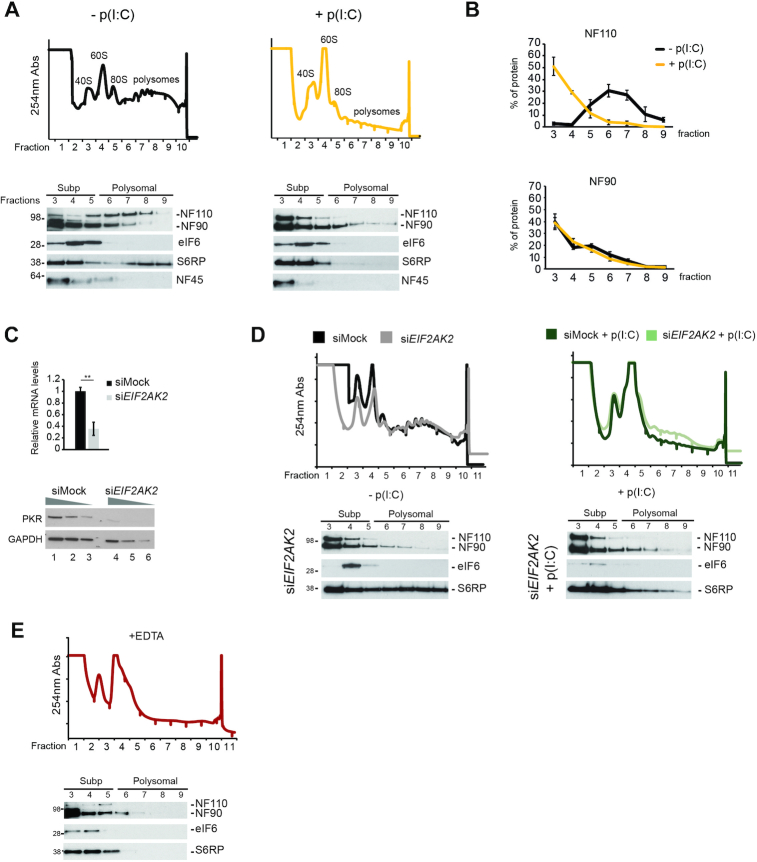
Figure 2.
ILF3 isoforms associate with polyribosomes (A) (top) Sucrose fractionation of cytoplasmic extracts from mock (top left) or poly(I:C) (top right) stimulated HeLa cells. UV absorbance (254 nm) is represented in the y-axis, for each of the fractions collected after centrifugation (x-axis) (bottom) western blot analyses for co-sedimentation studies of NF110, NF90 and NF45 in the collected fractions. eIF6 and S6RP serve as markers for free 60S and mature ribosomes containing 40S, respectively (representative blots for each condition) (B) Average (n = 5) distribution of the co-sedimentation of the NF110 (top) and NF90 (bottom) isoforms in polysomal fractionation during homeostasis (-p(I:C)) and the dsRNA-activated response (+p(I:C)) (C) qRT-PCR quantification of EIF2AK2 mRNA after transient depletion in HeLa cells (top), data shown are the average (n = 3) ± sem, (*) P-value < 0.05 by Student's t-test. Western blot analyses of PKR protein levels upon transient depletion (bottom), GAPDH serves as a loading control (D) (top) Sucrose fractionation of cytoplasmic extracts from PKR (EIF2AK2) depleted HeLa cells during mock (left) or dsRNA-stimulated conditions (right) (bottom) western blot analyses of NF90 and NF110 in fractions after gradient centrifugation of cytoplasmic extracts from PKR-depleted (siEIF2AK2) HeLa cells in the absence (left) and presence of dsRNA stimulation (right) (E) Sucrose fractionation of EDTA-treated cytoplasmic extracts.

