Figure 4.
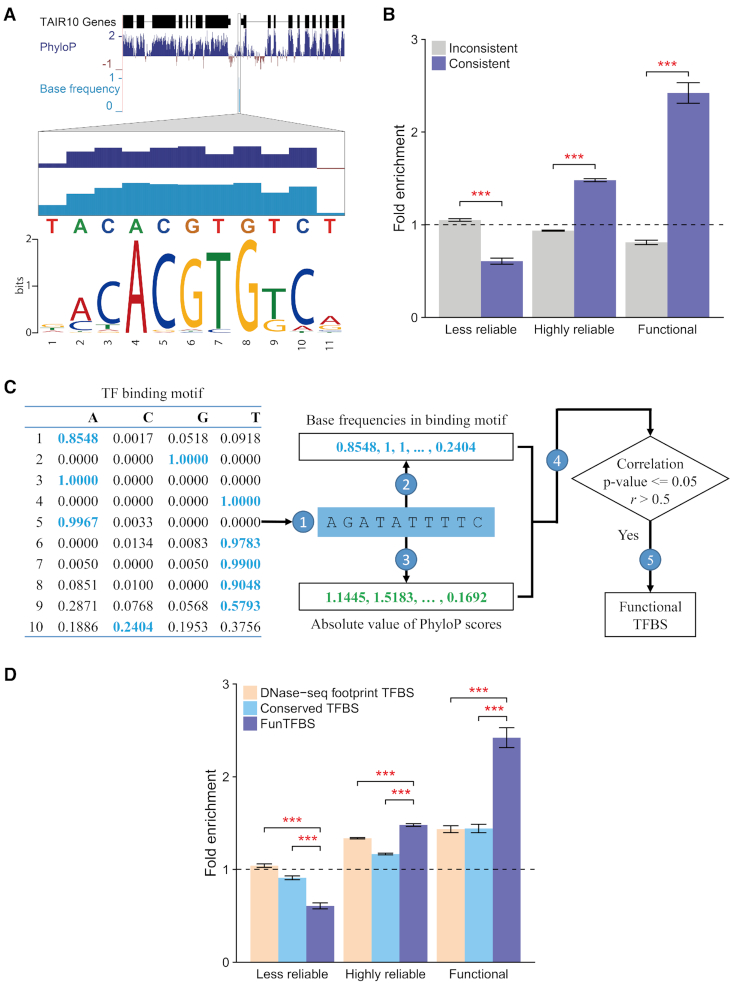
Screening for functional regulatory interactions by coupling the base-varied binding affinities of transcription factors (TFs) and consistent evolutionary constraints on their binding sites (TFBSs). (A) An example illustrating the consistency between the based-varied binding affinities (base frequency in the binding motifs) of the TFs and the evolutionary constraints on a functional TFBS. (B) Enrichment analysis of the TFBSs showing consistency or inconsistency between conservation scores and base frequencies in motifs in the ‘Less reliable’, ‘Highly reliable’, and ‘Functional’ categories of the evaluation dataset. The percentage of the TFBSs, directly scanned by motifs, included in each group of the evaluation dataset was used as the background. (Error bar indicates the standard deviation of the average fold change from 1 000 subsamples; the P-value was calculated based on the results from the 1000 subsamples, *** P-value < 0.001.) (C) An example workflow of the FunTFBS tool used to screen for functional transcription factor binding sites (TFBSs). For a TFBS candidate, the genomic sequences are extracted  , and the base frequency in the binding motifs
  and the PhyloP score
  for each base of the TFBS are calculated. Then, the Pearson correlation coefficient between the base frequencies in binding motifs and absolute value of PhyloP scores is calculated
  , and only the TFBS candidates with a significant correlation (P-value ≤ 0.05) and correlation coefficient greater than 0.5 are kept as functional TFBSs
  . (D) Enrichment analysis of the TFBSs using the TFBSs screened by DNase-seq footprints (DNase-seq footprint TFBS), conserved elements (Conserved TFBS), and evolutionary footprints (FunTFBS).

