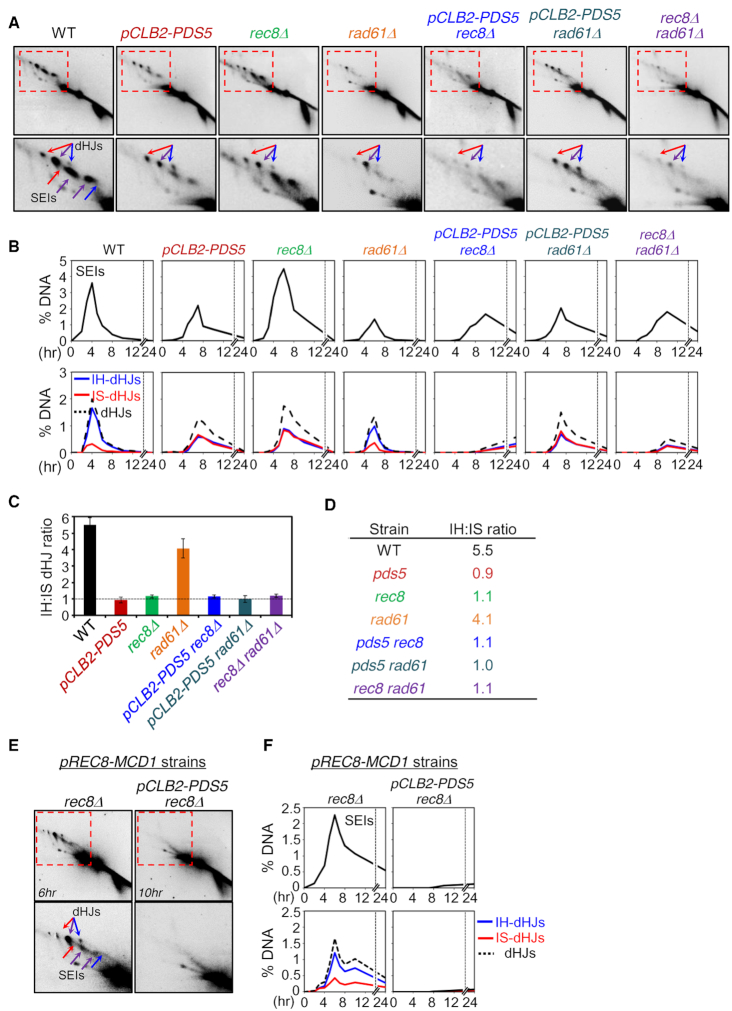
Figure 4.
JM Formation in pds5, rad61 and rec8 Mutants. (A) Images of 2D gel analysis at the HIS4LEU2 locus. Positions of SEIs and dHJs are indicated by arrows. Red arrows, mom–mom IS-JMs; blue arrows, dad–dad IS-JMs; purple arrows, mom–dad IH-JMs. (B) Quantification of SEIs and dHJs shown in (A). (C) IH:IS dHJ ratio at the HIS4LEU2 locus in WT, pCLB2-PDS5, rec8Δ, rad61Δ, pCLB2-PDS5 rec8Δ, pCLB2-PDS5 rad61Δ and rec8Δ rad61Δ. Error bars represent the mean ± SD (n ≥ 3). (D) Summary of IH:IS dHJ ratios. (E) 2D gel analysis in pREC8-MCD1 rec8Δ and pREC8-MCD1 pCLB2-PDS5 rec8Δ. (F) Quantification of SEIs and dHJs shown in (E).

