Figure 5.
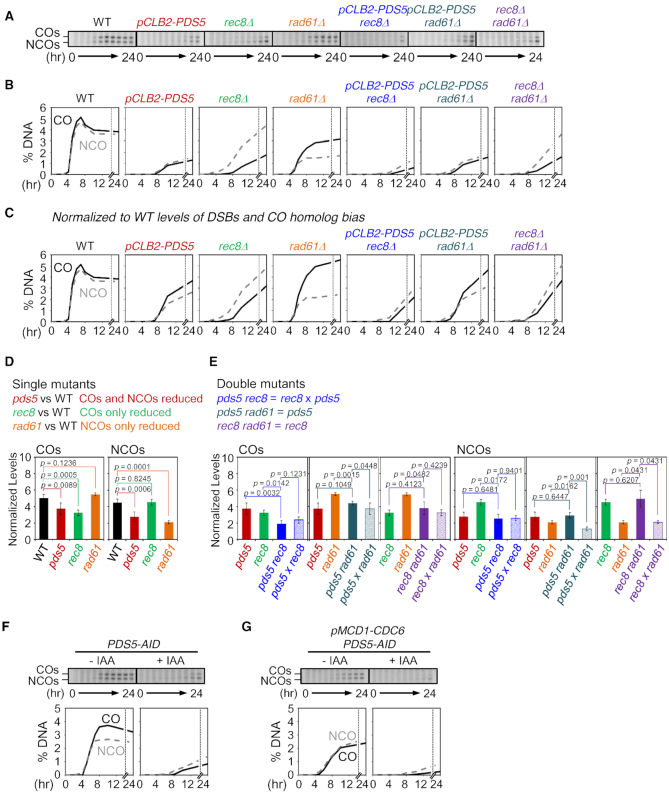
Roles of Pds5, Rad61 and Rec8 for COs and NCOs. (A) Gels of COs and NCOs in WT, pCLB2-PDS5, rec8Δ, rad61Δ, pCLB2-PDS5 rec8Δ, pCLB2-PDS5 rad61Δ and rec8Δ rad61Δ. (B) Quantification of COs and NCOs in (A). (C) Analysis of COs and NCOs. CO and NCO levels in mutants are normalized to WT levels of DSBs and CO homolog bias. (D andE) Mutant defects and epistatic relationships are defined by comparisons of normalized levels of COs and NCOs. (D, top) Mutant defects are defined by comparison of recombination levels of corresponding single mutants with WT. (E, top) Double mutant defects are analyzed by comparison of the double mutant defect with each of the two single mutant defects and the product of the two single mutant defects. Solid bars show mean values of normalized CO or NCO levels for the indicated mutant with error bars representing ± SD. Transparent bars in (E) are the levels predicted for independent contributions of the two component single mutant phenotypes (± SD), obtained by multiplying the values of the two single mutant defects (See ‘Materials and Methods’ section). P-values for all relevant comparisons are determined by Student's t-test. N ≥ 3 in all cases. See also Supplementary Table S3. (F andG) CO and NCO analysis at the HIS4LEU2 locus for PDS5-AID and pMCD1-CDC6 PDS5-AID in the presence or absence of auxin. Auxin (2 mM) was added to induce degradation of Pds5. Quantification of COs (black lines) and NCOs (gray dashed lines) were plotted.

