Figure 6.
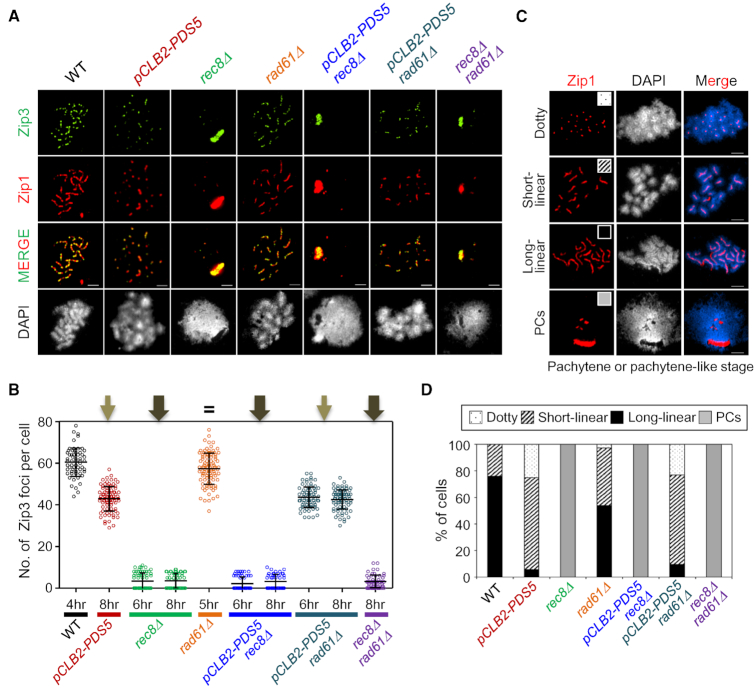
Analysis of CO-related Zip3 Focus Formation. (A) Localization of Zip3 together with Zip1 assembly of spread chromosomes in WT, pCLB2-PDS5, rec8Δ, rad61Δ, pCLB2-PDS5 rec8Δ, pCLB2-PDS5 rad61Δ and rec8Δ rad61Δcells immunostained for Zip3–13myc and Zip1. Scale bars represent 2.5 μm. (B) Quantification of the number of Zip3 focus. The colored scatter plots show the maximum number of Zip3 focus at pachytene or pachytene-like stage (4 h for WT; 8 h for pCLB2-PDS5; 6 h and 8 h for rec8Δ; 5 h for rad61Δ; 6 h and 8 h for pCLB2-PDS5 rec8Δ; 6 h and 8 h for pCLB2-PDS5 rad61Δ; 8 h for rec8Δ rad61Δ). Error bars indicate mean ± SD (n = 80–150). (C) Representative chromosome spreads of meiotic cells immunostained for Zip1. Zip1 staining was categorized into four classes: Dotty, punctate Zip1 staining; short-linear, short Zip1-stained lines; long-linear, intensely stained Zip1 lines; PCs, polycomplexes. The scale bars indicate 2.5 μm. (D) Bar graph indicating the percentages of Zip1 staining types in WT and mutant strains.

