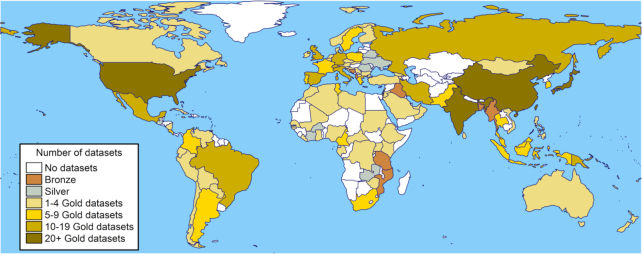
Figure 2.
Map showing the distribution of countries with data available for at least one classical HLA locus. Countries with no frequency/genotype data are shown in white; countries with only silver and/or bronze standard populations are shown in grey; gold standard populations are shown in light yellow (1–4 populations with gold standards), yellow (6–9), dark yellow (10–19), brown (≥20).

