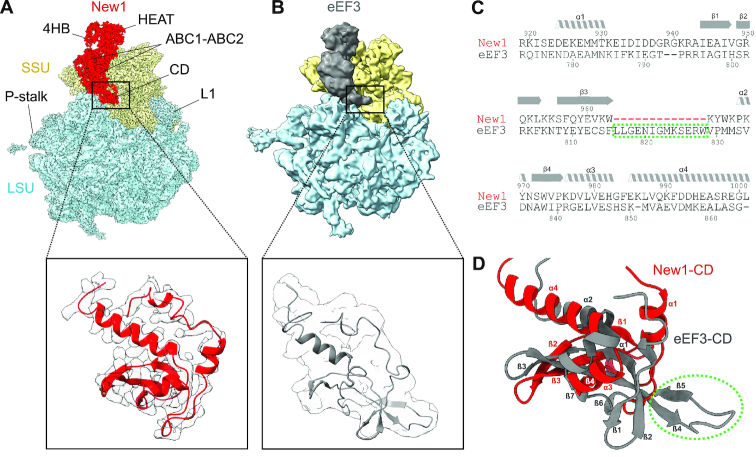
Figure 4.
Comparison of the chromodomain region of New1 and eEF3. (A) Cryo-EM reconstructions of the New1–80S and (B) the eEF3–80S (9.9 Å, EMD ID: 1233) complexes as well as zoom showing comparison of the New1–CD (red with grey cryo-EM density) with that of the eEF3 model (grey, PDB ID: 2ix8) (9). (C) Sequence alignment of the CD of New1 and EF3, highlighting truncated region in New1 (red dashes). (D) Comparison of structures of New1–CD (red) with eEF3-CD (grey, PDB ID: 2iw3) (9). The green dashed circle highlights the eEF3 residues, which are missing in the New1p sequence in (C).

