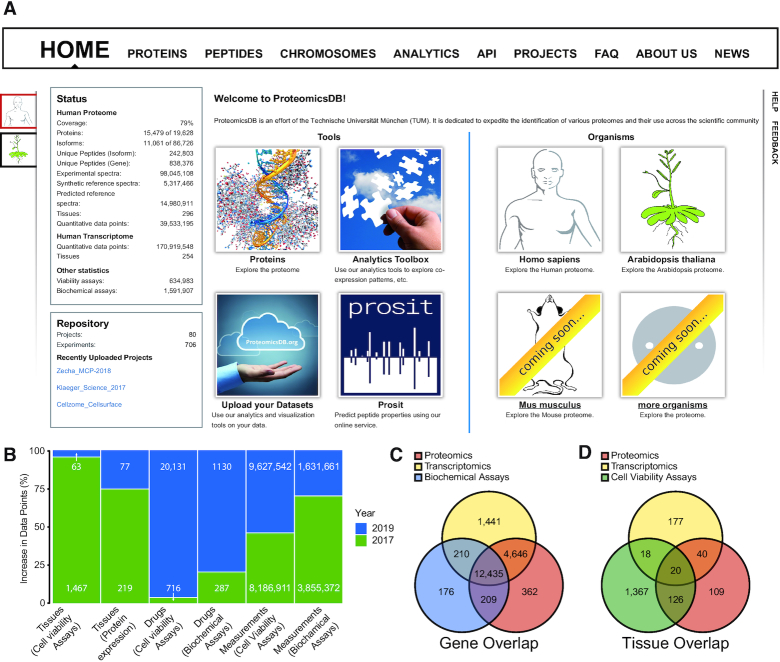
Figure 2.
Additions to ProteomicsDB. (A) The front page of ProteomicsDB has been adjusted to host new organisms as well as provide information about the quantity of the different data types that are stored in the database. (B) Barplot depicting the proportion and absolute number of data points added to ProteomicsDB (in blue) since the previous update manuscript in 2017 (green). (C) Venn diagram showing the number and overlap of genes for which proteomics, transcriptomics or biochemical assay data is available in ProteomicsDB. (D) Venn diagram showing the number and overlap of tissues (as well as cell lines and body fluids) for which the respective data types are available in ProteomicsDB.

