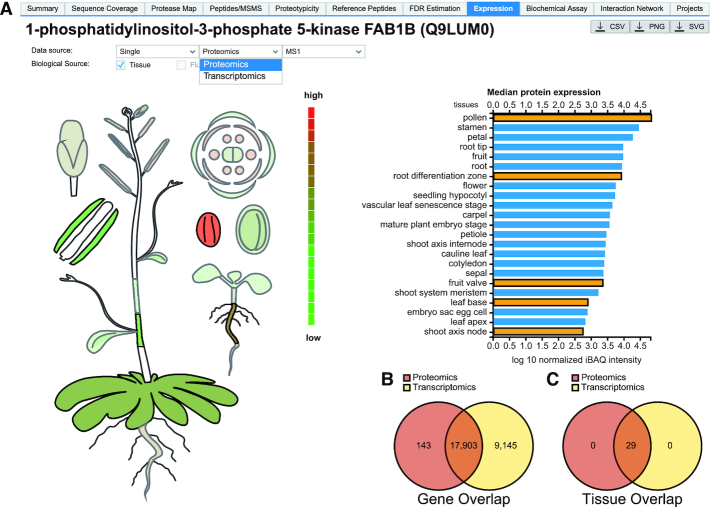
Figure 7.
ProteomicsDB as a multi-organism and multi-omics platform. (A) Proteome or transcriptome expression data are visualized in the tissues of a chosen organism (left) and numerical expression data (medians in case multiple samples of the same tissue are available) are shown on the right for each tissue the protein was found in. Tissue bars selected by users turn orange and the respective tissue is highlighted on the body map on the left view projects the tissue aggregated omics expression values to the corresponding organism's body map. (B) Venn diagram is showing the overlap of gene-level data available for proteomics and transcriptomics for Arabidopsis thaliana. (C) Venn diagram showing the overlap of tissues for which proteomics and transcriptomics expression values are available in ProteomicsDB.

