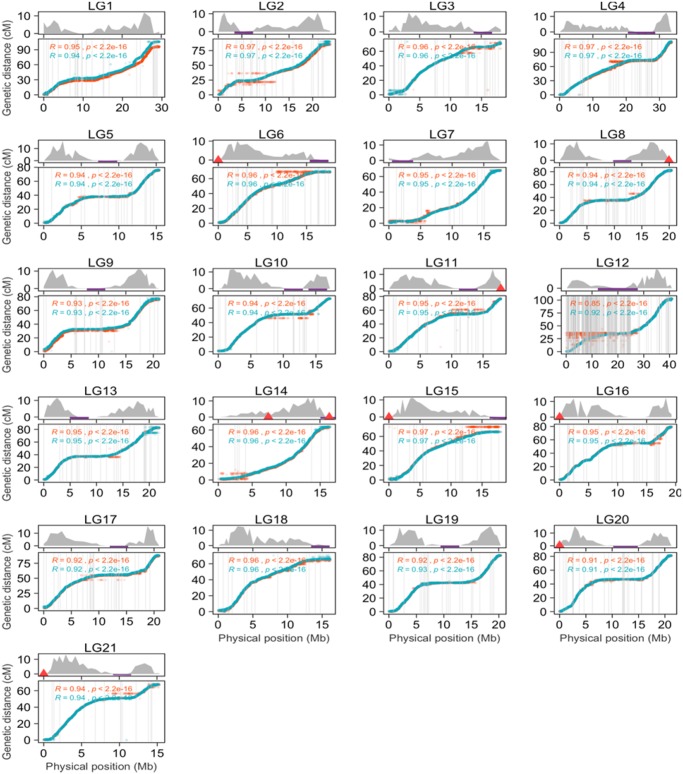
Fig. 1.
—Concordance of the assembly with linkage map. The plots represent the correspondence between genetic (cM; y axis) and physical (Mb; x axis) positions of the markers on each of the pseudo-chromosomes (bottom panels). The turquoise points correspond to the sex averaged map. The orange points are map positions from a technical replicate using a different subset of markers (see Materials and Methods). The gray lines represent the contig borders and the maximum value on x axis corresponds to the size of the pseudo-chromosomes in the assembly. The corresponding recombination rates (cM/Mb) are plotted along the length of each pseudo-chromosome (top panel). The potential telomeric regions in the assembly are marked with red triangles and the purple lines represent locations of the identified centromere-associated tandem repeat in the nine-spined stickleback genome.

