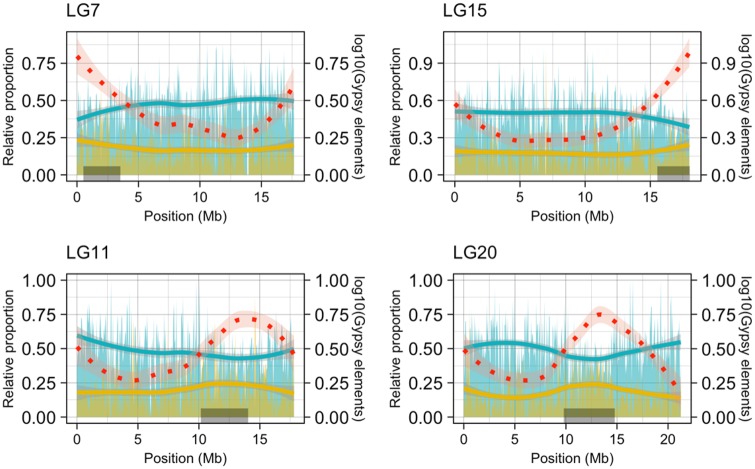
Fig. 4.
—Examples of relative proportions of LTR and DNA transposons along nine-spined stickleback pseudo-chromosomes. Distribution of relative proportions of LTR (yellow) and DNA TEs (blue) to total repeat content per 50 kb bin along selected pseudo-chromosomes (LG7, 11, 15, and 20). The red dotted line represents the log10 value of absolute abundance of LTR-gypsy elements across the pseudo-chromosomes. The gray rectangles (at the bottom) depict the pericentromeric region.

