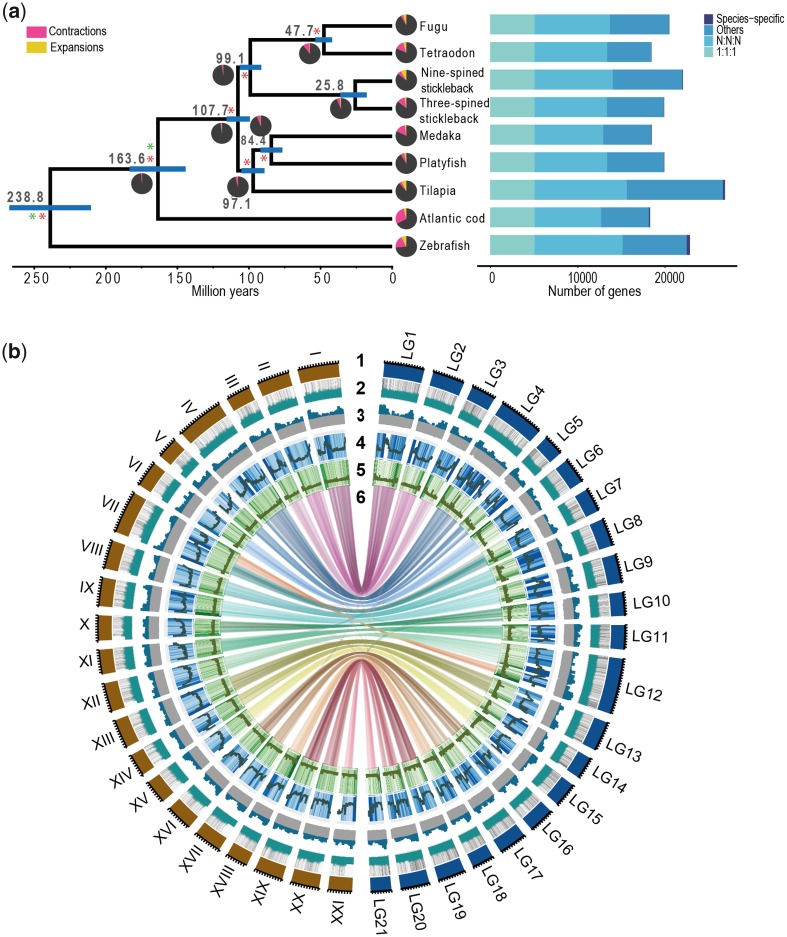
Fig. 5.
—Evolutionary and comparative genomic analysis. (a) Phylogenetic tree using orthogroups inferred from nine teleost species. The number of gene families expanded and contracted has been indicated in the pie diagrams in red and yellow, respectively. (b) Circos plot representing gene-level synteny between the nine- (right) and three-spined stickleback (left) genome assemblies. Tracks: 1, nine- and three-spined stickleback chromosomes; 2, gene density; 3, GC content; 4, TE density; 5, tandem repeat density; 6, links of synteny (defined by 10 collinear genes) between the two species.

