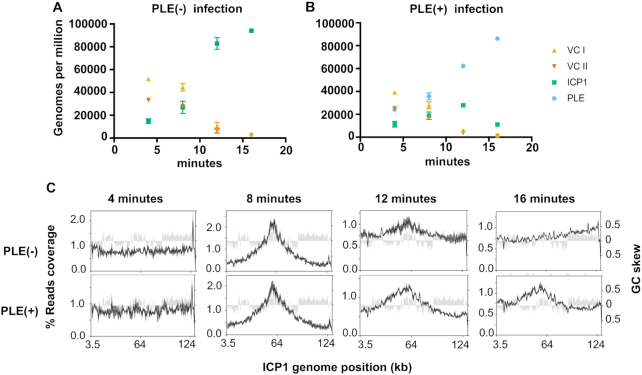
Figure 2.
PLE robustly replicates following infection while altering ICP1 replication. (A and B) Genomes per million (GPM) of total DNA mapping to the V. cholerae large (VC I) and small (VC II) chromosomes, ICP1, and the PLE across an infection time course in PLE(−) (A) and PLE(+) (B) V. cholerae. Samples were taken at 4, 8, 12 and 16 min post-infection, data show the average and standard deviation of three independent experiments. (C) Percent reads coverage plots across the ICP1 genome during PLE(−) (top) and PLE(+) (bottom) infection. For each time point, the percent reads coverage across the genome for three biological replicates was determined. The average percent reads coverage is shown as a black line, while standard deviation appears as dark gray shading around the line. The GC skew (right axis) is shown as light gray shading.

