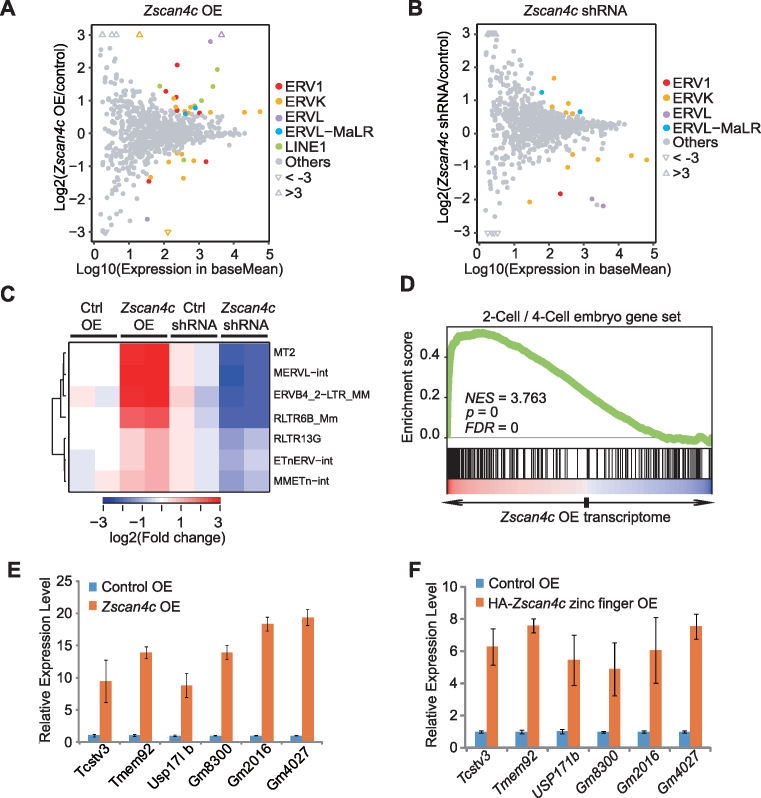
Figure 3.
Transcriptome analysis of Zscan4c-regulated retroelements and genes after Zscan4c overexpression or depletion. (A, B) Scatter diagrams of TE expression change after Zscan4c overexpression (OE) (A) and depletion by shRNA (B). TEtranscript results were used to plot these diagrams. Coloured dots indicate retroelements with significant expression change (Wald test, FDR adjusted P value < 0.05). Triangles represent ERVs with fold change >3. (C) Expression heatmap of selected retroelements after Zscan4c depletion and Zscan4c overexpression. Those selected TEs were upregulated after Zscan4c overexpression and downregulated after Zscan4c depletion (fold change > 1.5; Wald test, FDR adjusted P < 0.05). (D) Gene set enrichment analysis (GSEA) indicating that upregulated genes after Zscan4c overexpression were highly enriched in the 2-cell/4-cell embryo gene set. Red, upregulated genes; blue, downregulated genes. (E) qPCR analysis of the expression of 2-cell/4-cell embryo genes after Zscan4c overexpression in ESCs. (F) qPCR analysis of the expression of 2-cell/4-cell embryo genes after overexpression of Zscan4c zinc finger domains in ESCs. Biological-triplicate data (n = 3 extracts) are presented as mean ± s.e.m. Expression level of the control sample was set as 1. OE, overexpression.

